Sunday, May 9, 2010
The control of CO2 emission is becoming one of the most challenging environmental issues facing many countries today. Recent years has seen an increase in the reported use of process simulators to assess feasibility and design and troubleshoot of CO2 capture using amine solution. A simulation-optimization framework comprising of HYSYS simulator is presented and a jumping gene based multi-objective simulated annealing technique to evaluate the efficacy of CO2 removal using DEA solution. The novelty of this approach is that, both simulation and optimization of the process are performed simultaneously in an automated fashion to fully explore the trade-off surface of CO2 capture efficiency and operating cost.

The framework has been developed by integrating HYSYS simulator with a jumping gene based multi-objective simulated annealing technique and applied to CO2 capture process from a gas power plant. It has been shown to be capable of generating Pareto optimal solution involving CO2 capture efficiency and operating cost. Such Pareto set will form the basis for comparison with other amine technology. Future work include using other amine solutions as well as mixture of amines. Application to coal or fuel based power plant will also be part of future investigation.
DownloadRelated Topics
- Performance of Gas Sweetening with Mixture of DEA & MDEA
- HYSYS Simulation of MEA Based CO2 Removal
- Amines Type & Points Assist in Selection
- Several Concerns in High CO2 Field Development
- Correct model and thermo package in Amine system simulation using HYSYS
- Safety Moment with H2S
- What are the concerns related to H2S ?
- CO2 Related
Labels: Acid Gas Removal, CO2, Gas Sweethening
Tuesday, May 4, 2010
Methyldiethanolamine (MDEA), and Diethanolamine (DEA) have been used for CO2 & H2S removal in Gas sweetening unit. DEA is non-selective to CO2 and H2S. However, irreversible reactions of DEA with CO forming corrosive degradation products & increase corrosiveness. MDEA is highly selective to H2S with low corrosiveness. What is performance of mixtures of DEA and MDEA solutions in CO2 and H2S removal ?
In the present paper, the use of amine mixtures employing methyldiethanolamine (MDEA), and diethanolamine (DEA) have been investigated for a variety of cases using a ASPEN HYSYS process simulation. The simulation results show that,
- 40%MDEA with 10% DEA, 30% MDEA with 10 % DEA and 40% MDEA with 5% DEA were the best result in the absorption processes of CO2 from the natural gas.
- 30%MDEA with 10% DEA, 40%MDEA with 5 % DEA and 40%MDEA with 10 % DEA were the best result in the absorption processes of H2S from the natural gas comparing with other mixing amines.
- 20% MDEA with 10% DEA, 30% MDEA with 10 % DEA and the 40% MDEA with 10 % DEA have the lowers amount of H2S in the sweet gas comparing with different percent of DEA without mixing.
- The temperature of rich amine decrease with increase the circulation rate in all different percent of mixing amines and different percent of MDEA without mixing.
- The reboiler temperature was constant in the 20% MDEA with 10 % DEA and in the 30%MDEA, 40%MDEA and in the 50%MDEA, otherwise the reboiler temperature increase with increase the circulation rate in all different percent of mixing amines.
Related Topics
- HYSYS Simulation of MEA Based CO2 Removal
- Amines Type & Points Assist in Selection
- Several Concerns in High CO2 Field Development
- Correct model and thermo package in Amine system simulation using HYSYS
- Safety Moment with H2S
- What are the concerns related to H2S ?
- CO2 Related
Labels: Acid Gas Removal, CO2, Gas Sweethening
Monday, May 3, 2010
MEA (monoethanol amine) based CO2 removal process have been simulated with the ASPEN HYSYS process simulation tool with the Peng Robinson (PR) and Amines Property Package models which are available in Aspen HYSYS. The CO2 removal in % and the energy consumption in the CO2 removal plant are calculated as a function of amine circulation rate, absorption column height, absorption temperature and steam temperature.
Recommended :
Subscribes to FREE Hydrocarbon Processing
 Selection of type of solvent is complicated and subject to many parameters such feed gas composition and condition, gas impurities specification, life cycle cost, space, salt deposition, byproduct, losses, hydrocarbon absorption, etc. Read more in "Amines Type & Points Assist in Selection".
Recommended :
Subscribes to FREE Hydrocarbon Processing
Selection of type of solvent is complicated and subject to many parameters such feed gas composition and condition, gas impurities specification, life cycle cost, space, salt deposition, byproduct, losses, hydrocarbon absorption, etc. Read more in "Amines Type & Points Assist in Selection".An absorption and desorption process for CO2 removal with an aqueous MEA solution has been simulated. The exhaust gas from the power plant model is used as the feed to this model. The absorption column is specified with 10 stages each with a Murphy efficiency of 0.25. An estimated HETP (Height Equivalent to a Theoretical plate) of 4 meter, is about equivalent to 0.25 efficiency for each meter of packing. Traditional concentrations, temperatures and pressures are used in the base case simulation. The thermodynamics for this mixture is described by an Amines Property Package available in Aspen HYSYS. The Kent Eisenberg model is selected in the Amines Property Package. The Aspen HYSYS CO2 removal model is presented below.
With CO2 removal of 85 %, heat consumption is calculated to 3.7 MJ/kg CO2 removed, close to a literature value of 4.0 MJ/kg CO2.
Related Topics
- Amines Type & Points Assist in Selection
- Several Concerns in High CO2 Field Development
- Correct model and thermo package in Amine system simulation using HYSYS
- Safety Moment with H2S
- What are the concerns related to H2S ?
- CO2 Related
Labels: Acid Gas Removal, CO2, Gas Sweethening
Sunday, April 4, 2010
Carbon Dioxide (CO2) is known as one of industrial waste gas causing global warming...there are number of measures are implemented to reduce global warming. CO2 reduction measures are CO2 capturing, reinjection into aquifer, injection into reservior for well maintenance, gas injection for enhanced oil recovery (EOR), etc. CO2 being captured will be injected in the reservior. The injection can be as high as 300-400 atm which is higher than the critical pressure of CO2. Carbon dioxide is in its supercritical fluid state when both the temperature and pressure equal or exceed the critical point of 31°C and 73 atm (see diagram). In its supercritical state, CO2 has both gas-like and liquid-like qualities, and it is this dual characteristic of supercritical fluids that provides the ideal conditions for extracting compounds with a high degree of recovery in a short period of time. Read more in below...
Labels: CO2, Supercritical fluid
Saturday, August 22, 2009
Display problem ? Click HERE
Recommended :

Flare is commonly installed in oil and gas process plant to burn hydrocarbon and/or toxic gas to avoid formation of combustible mixture, to minimize green house effect (GHE), to minimize health hazards to personnel on site, etc. There are several earlier posts related to Flare :
- Quick Estimate Flare Stack Diameter
- Estimate Subsonic Flare Tip Pressure Drop With Graph Derived Correlation
- Quick Estimate Flare Tip Pressure Drop
- Flare Tip Type Quick Selection Chart
- Guideline on Quick Determination of Flare Stack Support Type
- Flare Smokeless Ringlemann Chart
- FLARE combustion efficiency
- Quick Estimate Ground Level Unburnt Flammable Gas For Vent Pipe or Flame-out Flare Stack
Flare collection header is normally "NO flow" as most (if not all) devices connected to flare header are non-discharging fluid into flare system. Among all are pressure relief valve (PRV), blowdown valve (BDV), overpressure dump valve (PCV), etc. All these devices are kept as close position during normal plant operation and will only open in the event of overpressure, emergency situation i.e. fire, runaway reaction, plant shutdown/blowdown for maintenance.
On the flare tip end, it is open to atmosphere. it is very likely that atmosphere air contain oxygen ingress and stay into flare collection header. PRV/BDV/PCV passing and open on demand will discharge large quantity of hydrocarbon gas into flare collector header filled with air and create combustible mixture, as this combustible mixture travel along flare header and reach flare tip which equipped with flare pilot, combustible mixture will be ignited and potentially created flash back to the flare header and flare knock-out drum (KOD). Subject to flare header capacity and mechanical integrity, large flash back lead to severe internal pressure act on the piping & vessel and vapor wave results severe vibration and movement of structure, this potential lead to catastrophe failure of flare collection system. Therefore a flare header is sweep or purge with fuel gas or inert gas i.e. Nitrogen.
Advantages using inert gas compare to fuel gas as purge gas
i) Environment & Green House Effect (GHE)
IG : Inert gas has NO impact to environment
FG : Burn fuel gas in atmosphere generate Carbon Dioxide (CO2) which contributes to increase of Co2 content in atmosphere and increases Green House Effect (GHE)
ii) Burn back damage flare tip - reduce life span of flare tip
IG : Inert gas do not burn. NO burn back and potential damage of flare tip.
FG : Potential FG burn back damage flare and shorten flare tip life span.
iii) High OPEX avoid Burn back
IG : NO burn back. Minimum purge rate and low OPEX.
FG : Potential burn back lead to high purge rate (potential 10 times higher than purge rate of IG) and high OPEX
iv) Visible Flame
IG : Inert gas do not burn. No flame present.
FG : FG continuous burn and continuous visible flare at flare tip. Potential create uneasy situation in environment sensitive area.
v) Smoke Flaring
IG : Inert gas do not burn. No smoke flaring issue.
FG : Burning heavy FG lead to smoke flaring. Potential create uneasy situation in environment sensitive area. Increase likelihood of unburnt component and impact on environment.
vi) Steam injection for smokeless flaring
IG : Inert gas do not burn. No smoke flaring issue.
FG : Burning heavy FG lead to smoke flaring. Steam injection to reduce/eliminate smoke flaring. This increases CAPEX (additional steam injection facilities) and OPEX (steam loss).
vii) Radiation
IG : Inert gas do not burn. No additional radiation.
FG : Fuel gas burn lead to increase of radiation level (on top of solar radiation) to personnel working near flare stack.
Disadvantages using inert gas compare to fuel gas as purge gas
a) Fuel Gas Readily Available in Plant
IG : Required Nitrogen generator or use of Liquid Nitrogen and evaporator. Additional CAPEX and OPEX.
FG : Fuel gas readily available in plant. Minimum CAPEX and OPEX. Some plant generate hydrocarbon gas which shall be disposed off. This gas is readily serve as purge gas and inccur NO cost.
b) Inert Gas Cloud
IG : Flare system purge with inert gas, entire flare system is filled with IG gas (which potential heavier than air). Once any PSV/BDV open and release large amount of gas into flare header, it will "push" IG release through the flare tip. Heavy IG (compare to air) will sink create a IG gas cloud near plant. This is potential fatal thread (suffocation) to personnel on site.
FG : Continuous flaring lead to no or nearly no potential of gas present in atmosphere
c) Unburnt hydrocarbon gas emission
IG : PRV/BDV/PCV leak or passing lead to low heating value mixure (less than 200 btu/ft3) which is non-combustible. Release of hydrocarbon gas into atmosphere directly has more GHE impact than burning it. For example 1 mol of methane create 1 mol of CO2 if it is burnt. 1 mol of methane create 20-21 mol of equivalent CO2 if it unburnt.
FG : Continuous flaring lead to no or nearly no unburnt gas in atmosphere
d) Combustible Cloud lead to Instant Ignition
IG : Slowly hydrocarbon gas emission to atmosphere and built-up of combustible mixture in the plant, once the heating value for auto-ignition is reached, the combustible mixture potentially ignited. Its impact is just like a explosion and potential thread to personnel and surrounding facilities.
FG : Continuous flaring lead to no or nearly no unburnt gas in atmosphere
Concluding remark
Inert gas purging is normally understood as clean, low CAPEX, low OPEX, etc and regards as most likely candidate for flare purging. However, the associated SAFETY related issue may needs additional attention and focus. All...use inert gas wisely...
Related Topic
- Flare related topics...
- CO2 related topics...
- Personnel Exposure Time For Heat Radiation
- Heat Radiation For Pain & Blistering Threshold
- Simplified Equation for Wind Speed Estimation At Different Height
- Estimate Wind Speed At Flare Tip At Different Height
- Assess AIV with "D/t-method" with Polynomial PWL Limit Line
- Model Fix Pressure Drop Device in FLARENET
Labels: CO2, Environment, Fire, Flare
Sunday, January 11, 2009
Display problem ? Click HERE
Recommended :
- Subscribe FREE - Processing Magazine
- Tips on Succession in FREE Subscription
 Earlier posts "Quick Estimation of CO2 Corrosion Rate", "CO2 Corrosion Rate Estimation Using M-506 Model" and "CO2 Corrosion Using Freecorp Model", the DeWaard Milliam model, Norsok M-506 model and FREECORP models have been introduced. All these corrosion estimation models are available FREE for all. Corrosion allowance (CA) is provided in pipeline / piping to cater for required design life. Low corrosion rate (CR) will require low CA. For high CR, higher CA is provided. In many events, corrosion inhibitor (CI) is injected into corrosive in order to reduce CR. Although low CA with CI injection, CI would incur high operation cost. Thus, a life cycle cost (LCC) study will require to be conducted to determining he cost effective option in provision of normal material with CA plus CI or Corrosion Resistance Material (CRA).
- Subscribe FREE - Processing Magazine
- Tips on Succession in FREE Subscription
Earlier posts "Quick Estimation of CO2 Corrosion Rate", "CO2 Corrosion Rate Estimation Using M-506 Model" and "CO2 Corrosion Using Freecorp Model", the DeWaard Milliam model, Norsok M-506 model and FREECORP models have been introduced. All these corrosion estimation models are available FREE for all. Corrosion allowance (CA) is provided in pipeline / piping to cater for required design life. Low corrosion rate (CR) will require low CA. For high CR, higher CA is provided. In many events, corrosion inhibitor (CI) is injected into corrosive in order to reduce CR. Although low CA with CI injection, CI would incur high operation cost. Thus, a life cycle cost (LCC) study will require to be conducted to determining he cost effective option in provision of normal material with CA plus CI or Corrosion Resistance Material (CRA).For the CA plus CI injection option, one of the factor shall be taken into account in determining CA is the availability of corrosion inhibition. There are many events would lead to corrosion inhibition unavailable i.e. maintenance, nonscheduled trip, deficiency of inhibition, unexpected flow, etc. Following is a simple method in determining the CA by consideration of Availability.
where :
CA = Corrosion rate
t = Design life
ICR = Inhibited Corrosion Rate
UCR = Uninhibited Corrosion Rate
Example :
A pipeline is design for 25 years, the corrosion rate is about 3 mm/year. High corrosion allowance (25 x 3 = 75 mm) is required and this has lead to injection of Corrosion Inhibition (CI) to reduce the corrosion rate to 0.3 mm/year. It is expected the availability of corrosion inhibition facilties is about 90%. Calculate CA required with CI injection.
t = 25
ICR = 0.3 mm / year
UCR = 3 mm / year
Av = 90%
CA = t x [ICR x Av + UCR x (1 - Av)]
CA = 25 x [0.3 x 90% + 3.0 x (1-90%)]
CA = 14.25 mm
Required CA is 14.25 mm.
A simple Corrosion Allowance Calculator is ready for download.
Download Corrosion Allowance Calculator (Excel).
Related Post
CA = t x [ICR x Av + UCR x (1 - Av)]
where :
CA = Corrosion rate
t = Design life
ICR = Inhibited Corrosion Rate
UCR = Uninhibited Corrosion Rate
Example :
A pipeline is design for 25 years, the corrosion rate is about 3 mm/year. High corrosion allowance (25 x 3 = 75 mm) is required and this has lead to injection of Corrosion Inhibition (CI) to reduce the corrosion rate to 0.3 mm/year. It is expected the availability of corrosion inhibition facilties is about 90%. Calculate CA required with CI injection.
t = 25
ICR = 0.3 mm / year
UCR = 3 mm / year
Av = 90%
CA = t x [ICR x Av + UCR x (1 - Av)]
CA = 25 x [0.3 x 90% + 3.0 x (1-90%)]
CA = 14.25 mm
Required CA is 14.25 mm.
A simple Corrosion Allowance Calculator is ready for download.
Download Corrosion Allowance Calculator (Excel).
Related Post
Labels: CO2, Corrosion, Corrosion Resistance Material
Sunday, November 9, 2008
Display problem ? Click HERE
 In earlier posts "Quick Estimation of CO2 Corrosion Rate" and "CO2 Corrosion Rate Estimation Using M-506 Model", two simple model i.e the DeWaard Milliam model and Norsok M-506 model have been introduced. The DeWaard Milliam model is just a simple chart while the M-506 model has been programmed into a software and available FREE for download.
In this post, another CO2 corrosion rate estimation software FREECORP will be introduced. FREECORP has been released for use by the corrosion research community. It was developed by scientists and programmers at Corrosion Center using publicly available knowledge of oil pipeline corrosion and it is distributed under GPL (General Public License) for FREE use by researchers, practitioners, and students of corrosion phenomena.
"FREECORP V1.0 is a simple corrosion model, strongly rooted in theory, which has been developed exclusively based on public knowledge. Currently, this model is capable of predicting uniform corrosion of carbon steel at a single point in an environment containing carbon dioxide, acetic acid, oxygen, and/or hydrogen sulfide. Iron carbonate film formation, a key factor in carbon dioxide corrosion, is simulated using an empirical correlation to improve the accuracy of corrosion rate prediction. Contributions to corrosion of various corrosion species can be calculated, which enables the exploration of dominant corrosion mechanisms in the corrosion process. Furthermore, polarization curves for each individual electrochemical reaction, net cathodic and anodic reactions and polarization sweeps can be optionally displayed. In a case of hydrogen sulfide corrosion, film formation is calculated and concentration profile of H2S across mass transfer layers on steel surface is displayed."
Related Post
Labels: CO2, Corrosion, Material
Tuesday, October 28, 2008
Display problem ? Click HERE
Recommended :
Subscribes to FREE Hydrocarbon Processing
Carbon Dioxide (CO2) with the present of free water in oil and gas would lead to generation of Carbonic acid. This has been briefly discussed in "CO2 Corrosion in Oil & Gas - Part 1". In this post and "CO2 Corrosion in Oil & Gas - Part 2", there are several articles related to CO2 corrosion.
In earlier discussion in "Quick Estimation of CO2 Corrosion Rate", other than DeWaard and Milliams model, there are other CO2 corrosion models :
- LIPUCOR model by TOTAL
- HYDROCORR model by SHELL
- CASSANDRA model by BP
- NORSOK M-506 model by NTSI
- KSC model
- IFE model
- etc
M-506 CO2 corrosion rate calculation model
This NORSOK standard, which is a recommended practice, contains
- a computer program for corrosion rate calculations
- a user manual for the computer program. A description of the calculation model, the algorithms and the conditions for the corrosion rate calculations are given. In additions, methods and algorithms for calculation of essential input parameters to the corrosion rate calculations are given.
Download Software
Related Post
- CO2 Corrosion in Oil & Gas - Part 1
- CO2 Corrosion in Oil & Gas - Part 2
- What are the concerns related to H2S ?
- Several Concerns in High CO2 Field Development
- How does Supercritical fluid looks like ?
- High Temperature Hydrogen Attack in metal & alloy
- Hydrogen Embrittlement TEST method
- Chlorride stress corrosion cracking and use of correct MOC for seawater
Wednesday, October 15, 2008
Display problem ? Click HERE
Carbon Dioxide (CO2) with the present of free water in oil and gas would lead to generation of Carbonic acid. This has been briefly discussed in "CO2 Corrosion in Oil & Gas - Part 1". In this post and "CO2 Corrosion in Oil & Gas - Part 2", there are several articles related to CO2 corrosion.
Since the initial studies by DeWaard and Milliams'(1975), there are many other follow-up studies on the CO2 corrosion phenomena. Many CO2 corrosion models have been proposed and used in predicting CO2 corrosion rate. They are :
DeWaard-Milliams nomograph
DeWaard and Milliams in their earlier studies has prepared a DeWaard-Milliams nomograph which is pretty simple and useful to have quick estimate for CO2 corrosion rate.
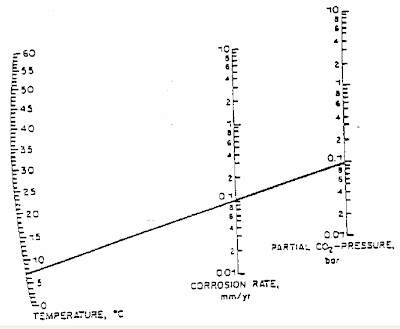
(Click to view larger image)
Since the initial studies by DeWaard and Milliams'(1975), there are many other follow-up studies on the CO2 corrosion phenomena. Many CO2 corrosion models have been proposed and used in predicting CO2 corrosion rate. They are :
- Dewaard- Milliam model
- LIPUCOR model by TOTAL
- HYDROCORR model by SHELL
- CASSANDRA model by BP
- NORSOK M-506 model by NTSI
- KSC model
- IFE model
- etc
DeWaard-Milliams nomograph
DeWaard and Milliams in their earlier studies has prepared a DeWaard-Milliams nomograph which is pretty simple and useful to have quick estimate for CO2 corrosion rate.
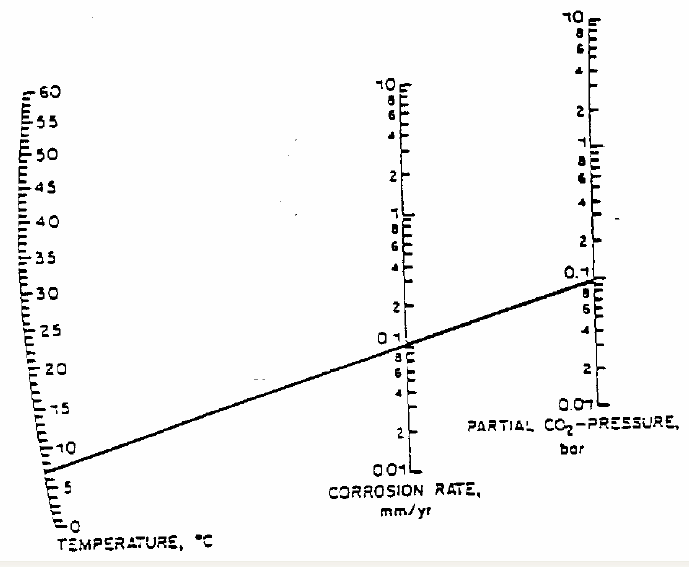
(Click to view larger image)
Above is an example where the fluid temperature is about 7 degC with CO2 partial pressure of 0.1 bar, the corrosion rate is 0.1 mm/year.
Related Post
Related Post
- CO2 Corrosion in Oil & Gas - Part 1
- CO2 Corrosion in Oil & Gas - Part 2
- What are the concerns related to H2S ?
- Several Concerns in High CO2 Field Development
- How does Supercritical fluid looks like ?
- High Temperature Hydrogen Attack in metal & alloy
- Hydrogen Embrittlement TEST method
- Chlorride stress corrosion cracking and use of correct MOC for seawater
Sunday, October 12, 2008
Display problem ? Click HERE
This is a continuation post from "CO2 Corrosion in Oil & Gas - Part 1" on the useful article related to CO2 corrosion in Oil & Gas.
Recommended :
- Tips on Succession in FREE Subscription
- Subscribe FREE - OilField magazine
 Use of artificial neural networks for predicting crude oil effect on CO2 corrosion of carbon steels
The role of crude oil on CO2 corrosion has gained special attention in the last few years due to its significance when predicting corrosion rates. However, the complexity and variability of crude oils makes it hard to model its effects, which can influence not only wettability properties but also the corrosivity of the associated brine. This study evaluates the usefulness of Artificial Neural Networks (ANN) to predict the corrosion inhibition offered by crude oils as a function of several of their properties which have been related in previous studies to the protectiveness of crude oils, i.e. nitrogen and sulfur contents, resins and asphaltenes, TAN, nickel and vanadium content, etc. Results showed that neural networks are a powerful tool and that the validity of the results is closely linked to the amount of data available and the experience and knowledge that accompany the analysis.
A Stochastic Prediction Model of Localized CO2 Corrosion
In this paper a two-dimensional (2-D) stochastic localized CO2 corrosion model is proposed, which describes the balance of two processes: corrosion (leading to metal loss) and precipitation (leading to metal protection). The model is able to predict localized corrosion of carbon steel in CO2 containing environments. The model uses corrosion rate and surface-scaling tendency predicted by a 1-D mechanistic corrosion model as the inputs. It can predict the possibility of localized corrosion as a function of primitive parameters such as temperature, pH, partial pressure of CO2, velocity, etc. The maximum pit penetration rate as well as the uniform corrosion rate can be predicted and used to describe the severity of the localized attack.
The effect of trace amount of H2S on CO2 corrosion investigated by using the EIS technique
A project has been initiated with the aim of extending the model to cover the effect of H2S on CO2 corrosion. This report covers one of the main building blocks necessary to complete the mechanistic CO2/H2S corrosion model, namely, electrochemistry of API 5L X65 carbon steel CO2 corrosion in the presence of small amounts of H2S (less than 340ppm). The corrosion process monitored by Linear Polarization Resistance (LPR) and Electrochemical Impedance Spectroscopy (EIS) showed a significant decrease in corrosion rate in the presence of H2S due to the metal surface coverage by a sulfide film. This sulfide film was identified as mackinawite by X-ray photoelectron spectroscopy (XPS). Since the experimental results suggested that the mechanism is a retardation of the charge transfer process, the surface coverage was calculated from the corrosion rate. The Langmuir-type adsorption isotherm was successful in modeling the surface coverage by mackinawite in the presence of trace amounts of H2S.
Iron carbonate scale formation and CO2 corrosion in the presence of acetic acid
The role of acetic acid (HAc) on X-65 mild steel carbon dioxide (CO2) corrosion has been investigated in the presence of iron carbonate scale (FeCO3). Free HAc is known to be a source of hydrogen ions and to lead to an increase in mild steel corrosion rates, especially at low pH values. Protective iron carbonate scales form at high temperatures (more than 60°C) and high values of pH. An interesting situation occurs when free HAc and protective FeCO3 scale co-exist. Numerous studies have looked at HAc and FeCO3 scale effects separately, but there is little knowledge of how the protectiveness of FeCO3 scale will be affected, in the presence of acetic acid. Some reports suggested FeCO3 scale thinning and loss of protection in the presence of HAc Thus in order to clarify this aspect of CO2 corrosion, the effect of HAc on FeCO3 scale protectiveness using 3 wt % NaC1 salt solution at T = 80°C has been studied under stagnant conditions. No effect of HAc on FeCO3 scale protectiveness was found over a range of pH and HAc concentrations.
Use and Abuse of EIS in Studying the Mechanisms of CO2/H2S Corrosion of Mild Steel
Electrochemical Impedance Spectroscopy (EIS) is a powerful transient technique which enables an insight into the corrosion process not easily obtained by other predominantly DC techniques. However the EIS technique presents a large challenge both from a theoretical as well as an experimental point of view. Collecting accurate EIS raw data is not easy as EIS is plagues with errors not seen by the DC techniques. Building mechanistic models to capture the EIS data is a very complex task which enables extraction of valuable information about the corrosion process, however the time and effort investment required is very large. In this study of CO2/H2S corrosion of mild steel it was found that a “minor” detail in the experimental set-up caused erroneous acquisition of EIS raw data. These data were “successfully” modeled by using a complex electrochemical theory, which appeared plausible. When the experimental mistake was discovered the EIS data were retaken, the analysis was redone and the conclusions about the corrosion process were completely revised.
Kinetics of Iron Sulfide and Mixed Iron Sulfide/Carbonate Scale Precipitation in CO2/H2S Corrosion
Glass cell experiments were conducted to investigate kinetics of iron sulfide and mixed iron sulfide/carbonate scale precipitation in CO2/H2S corrosion. Weight gain/loss (WGL) method was used to investigate the scale formation using X65 carbon steel as substrates. Scanning Electron Microscopy (SEM/EDS), X-ray Diffraction methodology (XRD), X-ray Photoelectron Spectroscopy (XPS), and Electron Probe Micro-analyzer (EPMA) were used to analyse the scale. The experimental results show that the corrosion products formed in CO2/H2S system depend on the competitiveness of iron carbonate and mackinawite. At high H2S concentration and low Fe2+ concentration, mackinawite was the predominant scale formed on the steel surface. At low H2S concentration and high Fe2+ concentration, both iron carbonate and mackinawite form. It was also found that ferrous ions forming mackinawite scale mainly come from Fe2+ released from the steel surface.
Experimental Study on Water Wetting and CO2 Corrosion in Oil-Water Two-Phase Flow
Internal corrosion occurs only when corrosive water wets the pipe inner wall. However, water wetting is one of most important missing links of our current overall understanding of internal corrosion of oil and gas pipelines. In this study, extensive experimental studies on water wetting in large diameter horizontal oil water pipe flows were carried out. Four main techniques (wall conductance probes, Fe2+ concentration monitoring, wall sampling and flow pattern visualization) were used to determine phase wetting on the internal wall of pipe at different superficial oil and water velocities. Four flow patterns were observed : stratified flow, stratified flow with mixed layer, semi-dispersed and dispersed flows. Three types of phase wetting regimes (water wetting, intermittent wetting and oil wetting) were determined. A comprehensive phase wetting map was obtained based on the overlapping information from these techniques.
Recommended :
- Tips on Succession in FREE Subscription
- Subscribe FREE - Upstream magazine
 CO2 Corrosion of Carbon Steel in High Ionic Strength Brine Solution
Recommended :
- Tips on Succession in FREE Subscription
- Subscribe FREE - Upstream magazine
CO2 Corrosion of Carbon Steel in High Ionic Strength Brine SolutionThe general CO2 corrosion rates of C1018 carbon steel have been measured for NaCl concentrations 3 – 25 wt% at 5ºC, pH4.0. The corrosion process was monitored by linear polarization resistance and potential dynamic sweeps. Experimental results show that high salt concentrations affect the general CO2 corrosion rate significantly and nonlinearly. Potentiodynamicsweep analysis shows that the high content of salt retards both cathodic and anodic process. No significant effects of velocity on corrosion rates are seen for various saline conditions
Basics Revisited - Kinetics of Iron Carbonate Scale Precipitation in CO2 Corrosion
Glass cell experiments were conducted to understand kinetics of iron carbonate scale formation in pure carbon dioxide (CO2) corrosion of mild steel. Weight gain and loss (WGL) method was used as a direct approach to investigate kinetics of scale formation. The experiments were done at the temperatures of 60oC to 90oC, and an iron carbonate supersaturation range of 12 to 350. It is found that the calculated results obtained by the previous kinetics expressions using the traditional dissolved ferrous ion concentration method are one to two orders of magnitude higher than the experimental precipitation rates obtained in the present study by the WGL method. The results show that the main source of the ferrous ions which are involved in formation of the protective iron carbonate scale is the iron dissolution process. It has been clearly demonstrated that the precipitation rate of iron carbonate is directly related to the conditions at the steel surface which can frequently be very different from the one in the bulk fluid.
Case Base Reasoning Model of CO2 Corrosion Based on Field Data
An important aspect in corrosion prediction for oil and gas wells and pipelines is to obtain a realistic estimate of the corrosion rate. Corrosion rate prediction involves developing a predictive model that utilizes commonly available operational parameters, existing lab/field data and theoretical models to obtain realistic assessments of corrosion rates. The Case-based Reasoning (CBR) model for CO2 corrosion prediction is designed to mimic the approach of experienced field corrosion personnel. The model takes knowledge of corrosion rates for existing cases and uses CBR techniques and Taylor series expansion to predict corrosion rates for new fields having somewhat similar parameters. The corrosion prediction using CBR model is developed in three phases: case retrieval, case ranking, and case revision. In case retrieval phase, the database of existing cases is queried in order to identify the group of cases with similar values of critical corrosion parameters. Those cases are ranked in the second phase, using a modified Taylor series expansion of the corrosion function around each case. The most similar case is passed to the third phase: case revision. The correction of the corrosion rate by using a mechanistic corrosion model is utilized in order to predict the corrosion rate of the problem under consideration. The (CBR) model has been implemented as a prototype and verified on a large hypothetical case database and a small field database with real data.
Investigation of the Localized CO2 corrosion Mechanism
Localized CO2 corrosion on mild steel is always associated with the partial breakdown of a protective corrosion product scale such as iron carbonate. The scale breakdown can happen for a variety of reasons many of them related to fluid flow. It is hypothesized that following the scale damage, a galvanic effect is established between the scale covered surface (cathode) and the scale free surface (anode) leading to propagation of localized attack. To test this hypothesis, in a series of laboratory experiments, an iron carbonate scale is formed by a repeatable process. Subsequently, in the so called “scale removal tests” the breakdown of the scale under flowing conditions is investigated. The results show that the iron carbonate scale can be partially removed by mechanical stresses, chemical dissolution or by both mechanisms acting simultaneously. In another series of experiments, a newly developed “artificial pit” test is used to investigate the propagation of localized CO2 corrosion via a galvanic coupling. The artificial pit is composed of a large cathode covered by protective iron carbonate scale, and a small bare steel anode. The two are electrically isolated and connected by a zero resistance ammeter to measure the galvanic current during the tests. The results have confirmed the galvanic mechanism for localized CO2 corrosion propagation. It has been demonstrated that pits will propagate only if the conditions are just right: the solution is neither under-saturated nor heavily supersaturated with respect to iron carbonate, i.e. they are in the so called “grey zone”.
Effect of Organic Acids on CO2 Corrosion
In the majority of the published work related to organic acid corrosion of mild steel, the focus is on acetic acid due to its prevalence in a typical organic acid mix seen in the field. In this work, the electrochemical behaviour of X65 carbon steel in the presence of other important organic acids (formic and propionic) and the effect that these have in the growth and protectiveness of iron carbonate (FeCO3) scale have been investigated. It was found that very little difference exists in electrochemical behaviour of the formic, acetic and propionic acids when it comes to CO2 corrosion of mild steel, given that the pH and concentrations of the undissociated organic acids is the same. Just like the other two weak organic acids, formic acid increases the corrosion rate due to an additional cathodic reaction: direct reduction of undissociated formic acid; this reaction is very temperature sensitive and may be limited by diffusion. The presence of organic acids makes it harder for protective iron carbonate scales to form due to a “scale undermining” effect. The scale precipitation rate is not directly affected, however, the time it takes to reach low corrosion rates is.
To be continue...
Related Post
Related Post
- CO2 Corrosion in Oil & Gas - Part 1
- What are the concerns related to H2S ?
- Several Concerns in High CO2 Field Development
- How does Supercritical fluid looks like ?
- High Temperature Hydrogen Attack in metal & alloy
- Hydrogen Embrittlement TEST method
- Chlorride stress corrosion cracking and use of correct MOC for seawater
Labels: Chloride Stress Corrosion Cracking, CO2, Corrosion
Thursday, October 9, 2008
Display problem ? Click HERE
Recommended :
Subscribe FREE - Utility Automation & Engineering T&D
 Carbon Dioxide (CO2), Hydrogen Sulphide (H2S), Mercury (Hg), Nitrogen (N2), Chloride (Cl) in formation water, etc are components present together in the feedstock for Oil and Gas production, refinery and Liquefied Natural Gas (LNG) production. Presence of CO2 and H2S with free water (H2O) can cause severe corrosion and Sulphide Stress Corrosion Cracking (SSCC) problems in
equipment and piping contact with the oil and gas. Read more in "What are the concerns related to H2S ?". Presence of Hg in Aluminum material i.e. coldbox and MCHE would lead to mercury embrittlement whilst Cl in hot stainless steel surface would lead to Chloride Stress Corrosion Cracking (CSCC). Read more in "Chloride Stress Corrosion Cracking & Use correct MOC for seawater service".
CO2 with presence of free water would lead to generation of Carbonic acid (H2CO3).
When Carbonic Acid contact with steel (Fe), reaction occur.
Useful Article Related to CO2 CorrosionSubscribe FREE - Utility Automation & Engineering T&D
Carbon Dioxide (CO2), Hydrogen Sulphide (H2S), Mercury (Hg), Nitrogen (N2), Chloride (Cl) in formation water, etc are components present together in the feedstock for Oil and Gas production, refinery and Liquefied Natural Gas (LNG) production. Presence of CO2 and H2S with free water (H2O) can cause severe corrosion and Sulphide Stress Corrosion Cracking (SSCC) problems inCO2 with presence of free water would lead to generation of Carbonic acid (H2CO3).
When Carbonic Acid contact with steel (Fe), reaction occur.
2Fe + H2CO3 ==> Fe2CO3 + H2
With minimum level of Oxygen would aggregate the corrosion :
Corrosion without Acid Carbonic :
and Corrosion with Acid Carbonic :
Carbonic acid is weak acid would reduce the pH of fluid and this further aggregate the corrosion.
Corrosion without Acid Carbonic :
and Corrosion with Acid Carbonic :
Carbonic acid is weak acid would reduce the pH of fluid and this further aggregate the corrosion.
Since the initial studies by DeWaard and Milliams'(1975), there are many other follow-up studies on the corrosion phenomena. Videm & Dugstad (1989), Dunlop, Hassell & Rhodes (1983), DeWaard, Lotz & Milliams (1991), But Dugstad (1992), DeWaard & Lotz (1993), Efird, Wright, Boros & Hailey (1993), Dugstad, Lunde & Videm (1994), etc have further studies the CO2 corrosion phenomenon. Following is compilation of articles related to CO2 Corrosion :
Integrated CO2 Corrosion - Multiphase Flow Model
An integrated CO2 corrosion – multiphase flow model was built which takes into account the effect of most important variables. The model is mechanistic in nature and resides on clear theoretical foundations. All the assumptions in the model are explicitly stated and are open to future adjustments and improvements. The overall model was extensively verified with a large experimental database and was able to perform reasonably well in all cases. The multiphase flow model was also benchmarked against a well-established commercial package.
CO2 Corrosion Mechanistic Modeling and Prediction in Horizontal Slug Flow
This paper presents a CO2 corrosion mechanistic model specifically developed for the horizontal multiphase slug flow. It covers electrochemical reactions at the steel surface, transport of reactive species between the metal surface and the bulk, and the chemistry in the bulk solution. The special mass transfer correlations in slug flow were applied in this model. The model can predict the corrosion rate in horizontal slug flow. Comparison with laboratory experimental corrosion results revealed that it could help the understanding of the internal corrosion of horizontal pipeline under slug flow condition. Furthermore, this model shows that the Froude number and the slug frequency are two important factors influencing the internal corrosion rates under multiphase slug flow. This provides an insight for the pipeline design and production under multiphase slug flow.
The Effect of CI- and Acetic Acid on Localized CO2 Corrosion in Wet Gas Flow
Wet gas corrosion rates of C1018 and X65 steel have been measured at the top and bottom of a
high pressure, 10 cm diameter horizontal pipeline under stratified flow conditions with different chloride (Cl-) concentrations. Experiments were performed for 200 hours at 90°C, CO2 partial pressure of 3.8 bar using a superficial gas velocity (Vsg) of 10 m/s and a superficial liquid velocity (Vsl) of 0.1 m/s. Three measurement techniques; ER, LPR, and WL were used simultaneously in the experiments. Localized corrosion occurred at the bottom of the pipe around the iron saturation point. The top of line was well protected by a thin corrosion product film and no localized corrosion was detected. C1018 and X65 have different sensitivities to pitting with a variation in Cl- concentration. Thus the pitting density concept is proposed to describe localized corrosion behavior. Surface analysis on iron carbonate films, by SEM and XRD, revealed different film thicknesses and crystal structures from the top to the bottom of the pipe. Cross-sectional analysis indicates that the thin corrosion product film, usually less than 10 microns, attached to the metal surface, is responsible for the low corrosion rate on top of the line, while the thick and porous film formed on the bottom, generally detached from the metal surface, was responsible for the initiation of localized corrosion.
Subscribes to FREE Hydrocarbon Processing
Top of Line Corrosion in Presence of Acetic Acid and Carbon Dioxide (CO2)
This paper deals with the phenomena of corrosion by acetic acid and carbon dioxide at the top of a horizontal pipeline under dewing conditions. The effect of different parameters known to influence the Top of the Line Corrosion (TLC), such as the condensation rate and the bulk temperature is studied. The free acetic acid concentration varies from 0 to 1000 ppm, the bulk temperature, is set mainly at 70oC, the condensation rate is varied while the partial pressure of carbon dioxide and the gas velocity are set at a fixed value. The presence of acetic acid increases the corrosion rate both at the top and at the bottom of the line in different ways. The condensation rate influences strongly the top of the line corrosion when it has a small influence at the bottom. Evidences of localized corrosion are found at the bottom of the line. The corrosion at the top is uniform in the experiments conducted.
CO2 Corrosion in the Presence of Trace Amounts of H2S
Experiments were conducted to determine the effect of an incremental change in the solution pH, from 4 to 6.6, on CO2 corrosion rates of AISI 1018 steel in the presence of H2S in both single phase flow (Vsl = 1 m/s) and multiphase flow (Vsg=3 m/s, Vsl= 1 m/s) in a large scale multiphase flow loop. Linear polarization probes, electrical resistance probes, and weight loss coupons were used to monitor corrosion rates during 4 to 10 day exposures to a CO2 saturated solution with trace amounts of H2S. The media for experimentation was a 1% NaCl solution at 60ºC, at 7.9 bar (100 psig) total pressure, with gas phase additions of H2S up to 100 ppm. Protective adherent films, seen under these conditions, limited corrosion rates in both single phase and multiphase flow conditions.
Iron carbonate scale growth and the effect of inhibition in CO2 corrosion of mild steel
Investigations were conducted to investigate iron carbonate scale precipitation, the interaction between a corrosion inhibition and the precipitating iron carbonate scale, and their effects on the corrosion rate. Both the effects of iron carbonate precipitation on inhibited and uninhibited surfaces and the effects of inhibition on surfaces with iron carbonate scale were studied. The experiments were done in glass cells at 80 °C and a iron carbonate supersaturation range of 7 – 150. A generic imidazoline based inhibitor was added at various points in the iron carbonate scale formation process. Both corrosion rates and precipitation rates were measured using electrochemical and weight gain/loss methods. The scale was later analyzed using scanning electron microscopy (SEM). It was found that the dissolved ferrous ion concentration method, used previously, overestimates the rate of iron carbonate precipitation. Although no antagonism was found under any of other conditions tested, it was seen that the addition of the inhibitor retarded the growth of the iron carbonate scale.
Effect of acetic acid, pH and MEG on the CO2 top of the line corrosion
This research work presents a study of Top of the Line Corrosion (TLC) on carbon steels in the
presence of carbon dioxide and acetic acid. The influence of different parameters such as the presence of mono-ethylene glycol (MEG) and the use of pH control were studied in a 4” diameter flow loop. Two sets of experiments were conducted; one at 70ºC, high CO2 partial pressure and a “critical” condensation rate and another one at 80ºC, low CO2 partial pressure and a high condensation rate. Weight loss techniques and surface analysis were used to evaluate the corrosion rate and products. It was found that the presence of HAc at the concentrations evaluated does not affect the general corrosion rate at the top of the line. Top of the line corrosion rates correlate with the De Waard / Lotz estimate of 10% of bottom of the line rates15. It is believed that the corrosion mechanism is still controlled by CO2 partial pressure at the experimental conditions evaluated in this study. The presence of MEG has not shown any effect on TLC due to the fact that the condensation rate was kept constant. The use of pH control in the supply is believed to limit the amount of HAc in the condensed water. No clear evidence of localized corrosion or pits can be reported at this stage of the study due to the short time of exposure.
CO2/H2S corrosion under scale forming conditions
Three different mild steel coupons with two different surface areas were exposed to a CO2 saturated multiphase environment with a trace amount of hydrogen sulfide under supersaturated scale forming conditions designed to increase the probability of localized corrosion. Corrosion testing was conducted in the region of low supersaturation values for iron carbonate (SSFeCO3 < 10) and three different supersaturation values for iron sulfide (2.5 < SSFeS < 125) through adjustment of the partial pressure of H2S during 30 day exposures to system conditions. Experiments were conducted in a 1% NaCl solution at 60ºC, pH 6.0, 0.77MPa partial pressure CO2 with trace amounts of H2S in both single phase flow (Vsl = 1 m/s) and multiphase flow (Vsg=3 m/s, Vsl= 1 m/s). Under the conditions tested, both siderite and mackinawite films were developed as adherent corrosion product films. Localized corrosion was observed.
Click CO2 Corrosion in Oil & Gas - Part 2 to continue...
Related Post
Integrated CO2 Corrosion - Multiphase Flow Model
An integrated CO2 corrosion – multiphase flow model was built which takes into account the effect of most important variables. The model is mechanistic in nature and resides on clear theoretical foundations. All the assumptions in the model are explicitly stated and are open to future adjustments and improvements. The overall model was extensively verified with a large experimental database and was able to perform reasonably well in all cases. The multiphase flow model was also benchmarked against a well-established commercial package.
CO2 Corrosion Mechanistic Modeling and Prediction in Horizontal Slug Flow
This paper presents a CO2 corrosion mechanistic model specifically developed for the horizontal multiphase slug flow. It covers electrochemical reactions at the steel surface, transport of reactive species between the metal surface and the bulk, and the chemistry in the bulk solution. The special mass transfer correlations in slug flow were applied in this model. The model can predict the corrosion rate in horizontal slug flow. Comparison with laboratory experimental corrosion results revealed that it could help the understanding of the internal corrosion of horizontal pipeline under slug flow condition. Furthermore, this model shows that the Froude number and the slug frequency are two important factors influencing the internal corrosion rates under multiphase slug flow. This provides an insight for the pipeline design and production under multiphase slug flow.
The Effect of CI- and Acetic Acid on Localized CO2 Corrosion in Wet Gas Flow
Wet gas corrosion rates of C1018 and X65 steel have been measured at the top and bottom of a
high pressure, 10 cm diameter horizontal pipeline under stratified flow conditions with different chloride (Cl-) concentrations. Experiments were performed for 200 hours at 90°C, CO2 partial pressure of 3.8 bar using a superficial gas velocity (Vsg) of 10 m/s and a superficial liquid velocity (Vsl) of 0.1 m/s. Three measurement techniques; ER, LPR, and WL were used simultaneously in the experiments. Localized corrosion occurred at the bottom of the pipe around the iron saturation point. The top of line was well protected by a thin corrosion product film and no localized corrosion was detected. C1018 and X65 have different sensitivities to pitting with a variation in Cl- concentration. Thus the pitting density concept is proposed to describe localized corrosion behavior. Surface analysis on iron carbonate films, by SEM and XRD, revealed different film thicknesses and crystal structures from the top to the bottom of the pipe. Cross-sectional analysis indicates that the thin corrosion product film, usually less than 10 microns, attached to the metal surface, is responsible for the low corrosion rate on top of the line, while the thick and porous film formed on the bottom, generally detached from the metal surface, was responsible for the initiation of localized corrosion.
Subscribes to FREE Hydrocarbon Processing
Top of Line Corrosion in Presence of Acetic Acid and Carbon Dioxide (CO2)This paper deals with the phenomena of corrosion by acetic acid and carbon dioxide at the top of a horizontal pipeline under dewing conditions. The effect of different parameters known to influence the Top of the Line Corrosion (TLC), such as the condensation rate and the bulk temperature is studied. The free acetic acid concentration varies from 0 to 1000 ppm, the bulk temperature, is set mainly at 70oC, the condensation rate is varied while the partial pressure of carbon dioxide and the gas velocity are set at a fixed value. The presence of acetic acid increases the corrosion rate both at the top and at the bottom of the line in different ways. The condensation rate influences strongly the top of the line corrosion when it has a small influence at the bottom. Evidences of localized corrosion are found at the bottom of the line. The corrosion at the top is uniform in the experiments conducted.
CO2 Corrosion in the Presence of Trace Amounts of H2S
Experiments were conducted to determine the effect of an incremental change in the solution pH, from 4 to 6.6, on CO2 corrosion rates of AISI 1018 steel in the presence of H2S in both single phase flow (Vsl = 1 m/s) and multiphase flow (Vsg=3 m/s, Vsl= 1 m/s) in a large scale multiphase flow loop. Linear polarization probes, electrical resistance probes, and weight loss coupons were used to monitor corrosion rates during 4 to 10 day exposures to a CO2 saturated solution with trace amounts of H2S. The media for experimentation was a 1% NaCl solution at 60ºC, at 7.9 bar (100 psig) total pressure, with gas phase additions of H2S up to 100 ppm. Protective adherent films, seen under these conditions, limited corrosion rates in both single phase and multiphase flow conditions.
Iron carbonate scale growth and the effect of inhibition in CO2 corrosion of mild steel
Investigations were conducted to investigate iron carbonate scale precipitation, the interaction between a corrosion inhibition and the precipitating iron carbonate scale, and their effects on the corrosion rate. Both the effects of iron carbonate precipitation on inhibited and uninhibited surfaces and the effects of inhibition on surfaces with iron carbonate scale were studied. The experiments were done in glass cells at 80 °C and a iron carbonate supersaturation range of 7 – 150. A generic imidazoline based inhibitor was added at various points in the iron carbonate scale formation process. Both corrosion rates and precipitation rates were measured using electrochemical and weight gain/loss methods. The scale was later analyzed using scanning electron microscopy (SEM). It was found that the dissolved ferrous ion concentration method, used previously, overestimates the rate of iron carbonate precipitation. Although no antagonism was found under any of other conditions tested, it was seen that the addition of the inhibitor retarded the growth of the iron carbonate scale.
Effect of acetic acid, pH and MEG on the CO2 top of the line corrosion
This research work presents a study of Top of the Line Corrosion (TLC) on carbon steels in the
presence of carbon dioxide and acetic acid. The influence of different parameters such as the presence of mono-ethylene glycol (MEG) and the use of pH control were studied in a 4” diameter flow loop. Two sets of experiments were conducted; one at 70ºC, high CO2 partial pressure and a “critical” condensation rate and another one at 80ºC, low CO2 partial pressure and a high condensation rate. Weight loss techniques and surface analysis were used to evaluate the corrosion rate and products. It was found that the presence of HAc at the concentrations evaluated does not affect the general corrosion rate at the top of the line. Top of the line corrosion rates correlate with the De Waard / Lotz estimate of 10% of bottom of the line rates15. It is believed that the corrosion mechanism is still controlled by CO2 partial pressure at the experimental conditions evaluated in this study. The presence of MEG has not shown any effect on TLC due to the fact that the condensation rate was kept constant. The use of pH control in the supply is believed to limit the amount of HAc in the condensed water. No clear evidence of localized corrosion or pits can be reported at this stage of the study due to the short time of exposure.
CO2/H2S corrosion under scale forming conditions
Three different mild steel coupons with two different surface areas were exposed to a CO2 saturated multiphase environment with a trace amount of hydrogen sulfide under supersaturated scale forming conditions designed to increase the probability of localized corrosion. Corrosion testing was conducted in the region of low supersaturation values for iron carbonate (SSFeCO3 < 10) and three different supersaturation values for iron sulfide (2.5 < SSFeS < 125) through adjustment of the partial pressure of H2S during 30 day exposures to system conditions. Experiments were conducted in a 1% NaCl solution at 60ºC, pH 6.0, 0.77MPa partial pressure CO2 with trace amounts of H2S in both single phase flow (Vsl = 1 m/s) and multiphase flow (Vsg=3 m/s, Vsl= 1 m/s). Under the conditions tested, both siderite and mackinawite films were developed as adherent corrosion product films. Localized corrosion was observed.
Click CO2 Corrosion in Oil & Gas - Part 2 to continue...
Related Post
- What are the concerns related to H2S ?
- Several Concerns in High CO2 Field Development
- How does Supercritical fluid looks like ?
- High Temperature Hydrogen Attack in metal & alloy
- Hydrogen Embrittlement TEST method
- Chlorride stress corrosion cracking and use of correct MOC for seawater
- Pitting Corrosion - Mechanism & Prevention
- How a Chloride Stress Corrosion Cracking Lookslike ?
Labels: Chloride Stress Corrosion Cracking, CO2, Corrosion
Sunday, July 6, 2008
Display problem ? Click HERE

Recommended (FREE) :
What Is ISO 14001 And Should I Care?
(USA & CANADA only)
 According to a study by the United States Department of Agriculture, an average person's respiration generates approximately 450 liters (roughly 900 grams) of carbon dioxide (CO2) per day. This roughly equivalent to 900 [g CO2/day] / 1000 [kg/g] x 365 days / year = 328.5 kg CO2 / year (724.2 lb Co2 /year)
Following tabulates average quantity of CO2 sequestered in a year (different species) :
- Calliandra calothyrsus (10 years old, 15 feets tall, 8 inches diameter) - 38.3 lbs CO2/tree/year
- Grevillia robusta (10-year-old, 45 feet tall, 6 inches diameter) - 64.6 lbs CO2/tree/year
- Acacia angustissima (2.5 years old, 15 feet tall, 3 inches diameter) - 21.5 lbs CO2/tree/year
- Albizzia lebbek (15 years old, 30 feet tall, 12 inch) - 68.9 lbs CO2/tree/year
- Pine and eucalyptus (mature) - 73.3 lbs CO2/tree/year
Mathematically to balance the CO2 emitted by a person is 724.2 / 73.3 ~ 10 nos of Pine & eucalptus (mature). 10 Tree per person is required to ensure the CO2 balance !!!.
Recommended (FREE) :
Gauging Green Opportunities: Taking Sustainable Building to a New Level
(USA, CANADA & UK only)
 Above figure has not included the methane release by tree and person decaying process where CO2 equivalent for 1 mole of methane is about 21 time !
Increasing growth rate of human being, high development and natural sources have reduced quantity of trees available for CO2 balance. Lets assume there is NO reduction of tree in the world and NO other activities (i.e. fossil fuel burning) generates CO2. This implies that we are still running in "deficit".
Can we really stop greenhouse effect (GHE) ?
Related Topic
Labels: CO2, Global warming, Greenhouse Effect
Friday, April 11, 2008
Display problem ? Click HERE
CO2 known as one of main contributor to global warming and greenhouse effect. Nowadays, CO2 sequestration and re-injection into disposal well is one of the common way to reduce CO2 emission into atmosphere. In earlier post Several Concerns in High CO2 Field Development, one of the effort taken was to separate CO2 from well gas and re-inject it back to disposal well.

Another direction in reducing CO2 emission to atmosphere is to convert CO2 to useful and valuable product. Sandia’s Sunshine Laboratory has invented a prototype device called the Counter Rotating Ring Receiver Reactor Recuperator (CR5), breaks carbon-oxygen (C-O) bonds in carbon dioxide (CO2) to form carbon monoxide (CO) and oxygen (O) in two steps. Water (H2O) and carbon monoxide (CO) will then produce methanol, gas, or other liquid fuels using solar energy. Read more in Sandia’s Sunshine to Petrol project seeks fuel from thin air.
Above effort no only reduce CO2 emission, it also reduce the demand of energy from well crude or gas. Nevertheless, there are still some "issue" needs to be resolved before it can be used as a workable alternative. Issues are :
Is overall process''s energy efficiency low ?It is believed that new invention always encounter disagreement and challenges from all parties with whatsoever reasons, however, the effort and objective behind this project shall be praised and appreciated.
Is overall energy effective ?
Operational ?
.
.
Related Topic
- Methane Conversion Challenge
- Several Concerns in High CO2 Field Development
- Use Ultra-Sonic Flowmeter in FLARE Gas Header for emission monitoring
- How does Supercritical fluid looks like ?
Labels: CO2, Global warming, Greenhouse Effect
Saturday, January 26, 2008

Nowadays, sweet field is getting less and less. Oil and gas activities are moving into exploration and production of high Carbon Dioxide, high mercury and sour field. One of the example is recent project on a gas field development which contains very high carbon dioxide (~ 40% CO2), reasonably high Hydrogen Sulphide (>120ppm h2S), high mercury level (> 5000 microgram/Nm3 at 25 barg) and high sand production (> 2 kg/h) as discussed in "Several Concerns in High CO2 Field Development".
With present exploration & production environment, minimizing release of CO2 to atmosphere and injection into reservoir is for well maintenance and disposal is generally encouraged. Release of of H2S to atmosphere is prohibited. H2S is normally injected together with Co2 gas or recover to produce sulphur (S) as by product. Handling sulphur in powder form potential poses the danger of fire or possibly dust explosions.
Another article (by BARTEC) "Dust Explosion Protection" would bring some additional information on dust explosion.
One of the recommended standard for prevention of fire and dust explosion is NFPA 654 – Standard for the Prevention of Fire and Dust Explosions from the Manufacturing, Processing, and Handling of Combustible Particulate Solids. You may visit NFPA website to obtain a formal copy.
While dealing with dust explosion and NFPA 654, the following questions may be raised :
Related Topic
With present exploration & production environment, minimizing release of CO2 to atmosphere and injection into reservoir is for well maintenance and disposal is generally encouraged. Release of of H2S to atmosphere is prohibited. H2S is normally injected together with Co2 gas or recover to produce sulphur (S) as by product. Handling sulphur in powder form potential poses the danger of fire or possibly dust explosions.
"Eighty percent of all industrial dusts are combustible, and even a dust layer of 1 mm in a closed room is sufficient to trigger an explosion when the dust is swirled up and ignited. These facts, combined with the fact that those affected are not sufficiently aware of the danger (in contrast to the danger of gas explosions) underlines the importance of preventing dust explosions. "What is dust explosion ? What are the factors affecting dust explosion ? What are the protection measures ? How to selection equipment dealing with powder from dust explosion perspective ?... The following article (by STAHL) will help you analyse the danger of a dust explosion in your facilities and to take the suitable technical and organisational steps to minimise this risk.
Another article (by BARTEC) "Dust Explosion Protection" would bring some additional information on dust explosion.
One of the recommended standard for prevention of fire and dust explosion is NFPA 654 – Standard for the Prevention of Fire and Dust Explosions from the Manufacturing, Processing, and Handling of Combustible Particulate Solids. You may visit NFPA website to obtain a formal copy.
While dealing with dust explosion and NFPA 654, the following questions may be raised :
- What is NFPA 654 and how does it affect my plant?
- Who is responsible for implementing NFPA 654 standards at the plant?
- What explosion protection methods are required by NFPA 654?
- How do I begin the process protection design to comply with NFPA 654?
- What process equipment is covered by NFPA 654 ?
- All of my process equipment has deflagration venting installed on it. Is that all I have to do?
- Does ‘return air’ to the plant from an air separation device present a danger?
- Where should I consider the use of building vents?
Related Topic
- Several Concerns in High CO2 Field Development
- Correct model and thermo package in Amine system simulation using HYSYS
- How does Supercritical fluid looks like ?
- Canada Aim For 20% cut in CO2 emissions by 2020
- OGT - Others FREE articles related to Amine & CO2...
- Optimized Gas Treating, Inc. (OGT) - Experts in CO2-Amine
