Saturday, March 27, 2010

Let's do it together !
Earth Hour 2010 will drop on March 27th, 2010, 8.30pm Local time. The effort is simple for everyone :
TURN OFF ALL NON-ESSENTIAL ELECTRICAL APPLIANCE FOR 60 MINUTES from 8.30pm to 9.30pm Local time
We in Chemical & Process, Oil and Gas industries known as one of the major "contributor" in global warming is encourage to take this opportunity to take some effort...
See more video clip in "Earth Hour 2010 - You can Help Our Friend... Environment..."
Visit Earth Hour website : http://www.earthhour.org/
Related Topic
- Earth Hour - Simple Effort Minimise Global Warming
- Green Calculator - How Much Energy Could Your Company Save ?
- Is Your Company "Green" Enough ?
- Serious Efforts In Minimising GreenHouese Effect (GHE) Emission
- Can We Really Stop Greenhouse Effect (GHE) ?
- Several Concerns in High CO2 Field Development
- Environment related...
Labels: Environment, Global warming, Greenhouse Effect
Friday, March 19, 2010
Earth hour is an effort by WWF (World Wide Fund for Nature/World Wildlife Fund) to create awareness on global warming and the need to take action on climate change. All of us can participate in this annual event. Last year 2009, Chemical & Process Technology has participate as well..."Earth Hour - Simple Effort Minimise Global Warming".
In 2009 hundreds of millions of people around the world showed their support by turning off their lights for one hour. You may see the following video clips showing what happened in 2009.
Earth Hour 2010 will drop on March 27th, 2010, 8.30pm Local time. The effort is simple for everyone. It is simple :
TURN OFF ALL NON-ESSENTIAL ELECTRICAL APPLIANCE FOR 60 MINUTES from 8.30pm to 9.30pm Local time
We in Chemical & Process, Oil and Gas industries known as one of the major "contributor" in global warming is encourage to take this opportunity to take some effort...
Visit Earth Hour website : http://www.earthhour.org/
Related Topic
- Earth Hour - Simple Effort Minimise Global Warming
- Green Calculator - How Much Energy Could Your Company Save ?
- Is Your Company "Green" Enough ?
- Serious Efforts In Minimising GreenHouese Effect (GHE) Emission
- Can We Really Stop Greenhouse Effect (GHE) ?
- Several Concerns in High CO2 Field Development
- Environment related...
Labels: Environment, Global warming, Greenhouse Effect
Thursday, March 18, 2010
Atmospheric storage tank normal venting based on API Std 2000 6th edition, Nov 2009 has been discussed in "Tank Normal Venting Rate Estimation Using Latest Method As in API Std 2000". Ankur, an experience engineer in Chemical industry, actively involved in CheResource Forum, has take his effort and time to program it in Microsoft Excel spreadsheet. Thanks to Ankur.
As reminder, the information and methods included within this spreadsheet are presented for common sharing and intended to be used by technically skilled persons at their own discretion. We do not warrant the suitability or accuracy of these methods.
Insulation type and recommended thermal conductivity have also been included in the spreadsheet for easy reference. The insulation type and thermal conductivity as follow :
| Common Insulation Materials | Average Thermal Conductivity, W/m-K |
| Cellular glass | 0.05 |
| Mineral Fiber | 0.04 |
| Calcium Silicate | 0.06 |
| Perlite | 0.07 |
Products contain volatile components or dissolved gases or flashing products may result adddtional volatile component / gases / vapor. This amount will increase the outbreathing rate.
Products stored at temperature above 40 degC or its vapor pressure higher than 5.0 kPa, products evaporation rate shall be added into outbreathing rate.
Read and download spreadsheet in "Tank Normal Venting Rate Estimation Using Latest Method As in API Std 2000".
* If you find any error or improvement, please inform us.
**If you have any useful program and would like to share within our community, please send to me.
Related Post
- Tank Normal Venting Rate Estimation Using Latest Method As in API Std 2000
- Tank Venting - API Std 2000 (Nov 2009) - Revised method and Old Method in ANNEX A
- Tank Thermal Breathing - Proposed Equation Correlate API Std 2000 (Annex A)
- Tank Normal Venting Rate Estimation Using Siddhartha Equation
- Find Latitude & Longitude Using GOOGLE MAP
Labels: Environment, Overpressure Protection, Tank
Wednesday, March 17, 2010
Liquid in tank truck or storage tank may spill on the ground. Wind blowing, solar and ground surface heating will results evaporation of spilled liquid. The evaporation rate is one of the key information required during design phase for consequence analysis and preparation of emergency handling measures. What is the quick way to estimate evaporation rate ?
Evaporation rate from spilled liquid subjects to several factors such as :
- spilled liquid volatility
- spilled liquid properties
- spilled liquid surface area expose to wind blowing
- spilled liquid temperature
- wind speed
Evaporation rate of spilled liquid can be estimated using following equation
E = (0.284 U0.78.MW2/3.A.VP) / (82.05 T)
where
E = Evaporation rate (lb / min)
U = Wind speed above spilled liquid surface (m/s)
MW = Spilled liquid molecular weight
A = Spilled liquid surface area (ft2)
VP = Spilled liquid vapor pressure at liquid temperature (mmHg)
T = Spilled liquid temperature (K)
Spilled Liquid Surface Area
Spilled liquid surface area is normally fix by the containment itself. Liquid spilled from tank into diked area, the spilled liquid surface area will be the diked area itself unless the spilled quantity is so small where it will not covers entire diked area. To estimate spilled liquid surface area without any containment, it is assumed that the spilled liquid will have 10mm (or 0.033 ft) thickness. Therefore,Spilled liquid surface area (ft2)
A = V / 0.033
where
V = Spilled liquid volume (ft3)
Example
Methanol with vapor pressure (VP) of 125 mmHg and MW of 32.04 stored at 25 degC in a 25,000 US gal tank (10 ft diameter). Overfilled methanol results spillage of 1,000 US gal of methanol spread in the diked area (100ft x 40 ft) which contain 8 identical tanks. Assuming wind speed is 1.5 m/s, estimate evaporation rate.
Spilled volume,
V = 1000 US gal
V = 1000 / 7.48051948 ft3
[1 ft3 = 7.48051948 US gallons]
Spilled area (without containment),
Awc = V / 0.033
Awc = (1000 / 7.48051948) / 0.033
Awc = 4,050 ft2
Diked area,
Adike = Total dike area - tank area
Adike = 100x40 - 8 x (PI x 10^2)/4
Adike = 3371.7 ft2
Since Awc is larger than Adike, entire dike area will be occupied by spilled liquid.
Inputs
U =1.5 m/s
MW =32.04
A =3371.7 ft2
VP =125 mmHg
T =25 + 273.15 = 298.15 K
Evaporation rate
E = (0.284 U0.78.MW2/3.A.VP) / (82.05 T)
E = (0.284x1.50.78.(32.04)2/3.3371.7.125) / (82.05x298.15)
E = 67.7 lb / min
Above method is a quick method in determining evaporation rate.
Above method is a quick method in determining evaporation rate.
Related Post
- Tank Normal Venting Rate Estimation Using Latest Method As in API Std 2000
- Tank Venting - API Std 2000 (Nov 2009) - Revised method and Old Method in ANNEX A
- Tank Thermal Breathing - Proposed Equation Correlate API Std 2000 (Annex A)
- Tank Normal Venting Rate Estimation Using Siddhartha Equation
- Two Useful Equations For Flow Conversion between Air - Vapor & Actual - Standard
- Relate NORMAL to STANDARD Volumetric Flow
- Relate NORMAL to ACTUAL Volumetric Flow
- Environment related
Labels: Environment, Greenhouse Effect
Tuesday, March 9, 2010

Earlier post "Is Your Company "Green" Enough ?", an Green Assessment using radar chart is introduced by Infor . The Green Assessment tool will allows you to assess how far your company's efforts in achieving a Green organization. This Green Assessment is benchmarked with many other companies and other industries.
Again Infor introduce another Green Calculator to estimate the potential of energy and costs saving that you can achieve using the EAM Asset Sustainability method. The Infor Energy Savings Calculator is designed to analyze your company’s current power usage and policies, and provide recommendations to help reduce energy costs and drive green initiatives.
Check out Green Calculator...
Related Post
Check out Green Calculator...
Related Post
Labels: Environment, Green Technology
- Tips on Succession in FREE Subscription
- Subscribe FREE - Processing Magazine
Liquid product like Chemical, condensate, etc is commonly stored in fixed roof vertical cylindrical tank. Inert gas blanketing system is provided to avoid air and moisture contact and contaminate liquid product. Liquid movement by content filling (pump-in) or emptying (pump out) and weather changes (ambient heating or cooling) will results internal pressure increase (overpressure) or decrease (vacuum) in the tank. Thus, a protecting system providing inbreathing or outbreathing gas is provided to maintain a constant pressure in the tank.
Inbreathing
Emptying (pump-out) and ambient cooling will lead to normal inbreathing. General equation to determine inbreathing flow :
Vin,air = Vpe + CVtk0.7 Ri
where
Vin,air = Total inbreathing in Nm3/h (Air)
Vpe = Pump-out or emptying in m3/h
Vtk = Tank capacity in m3
Ri = Insulation reduction factor
C = Factor subject to vapor pressure, average temperature and latitude (see Table 1)
C = Factor subject to vapor pressure, average temperature and latitude (see Table 1)
| Table 1 : C-factor for Inbreathing | ||||
| Latitude | Vapor Pressure | |||
| Hexane or similar | Higher than hexane or unknown | |||
| Average Storage Temperature (oC) | ||||
| < 25 | >=25 | < 25 | >=25 | |
| Below 42o | 4 | 6.5 | 6.5 | 6.5 |
| 42o to 58o | 3 | 5 | 5 | 5 |
| Above 58o | 2.5 | 4 | 4 | 4 |
Outbreathing
Filling (pump-out) and ambient heating will lead to normal outbreathing. General equation to determine outbreathing flow :
Vout,air = Vpf + YVtk0.9 Ri
where
Vout,air = Total Outbreathing in Nm3/h (Air)
Vpf = Pump-out or filling in m3/h
Vtk = Tank capacity in m3
Ri = Insulation reduction factor
Ri = Insulation reduction factor
Y = Factor subject to latitude (see Table 2)
Special notes :
i) If products contain volatile components or dissolved gases or flashing products, perform flashing calculation to estimate quantity of volatile component / gases / vapor. This amount shall be added into outbreathing rate.
ii) If products stored temperature above 40 degC or its vapor pressure higher than 5.0 kPa, products evaporation rate shall be added into outbreathing rate.
iii) Quick check on plant latitude, check out in "Find Latitude & Longitute Using GOOGLE MAP"
If no insulation,
Lin = Insulation thickness in m
Lamdain = Insulation thermal conductivity in w/mK
| Table 2 : Y-factor for Outbreathing | ||||
| Latitude | Y-factor | |||
| Below 42o | 0.32 | |||
| 42o to 58o | 0.25 | |||
| Above 58o | 0.2 | |||
Special notes :
i) If products contain volatile components or dissolved gases or flashing products, perform flashing calculation to estimate quantity of volatile component / gases / vapor. This amount shall be added into outbreathing rate.
ii) If products stored temperature above 40 degC or its vapor pressure higher than 5.0 kPa, products evaporation rate shall be added into outbreathing rate.
iii) Quick check on plant latitude, check out in "Find Latitude & Longitute Using GOOGLE MAP"
Determination of Ri = Insulation reduction factor
If no insulation,
Ri = 1
If fully insulated including Shell and roof,
Ri = Rin = (1 + h x Lin / Lamdain)-1
If partial insulated,
Ri = Rinp
Ri = (Ainp / ATTS).Rin + [1-(Ainp / ATTS)]
Lin = Insulation thickness in m
Lamdain = Insulation thermal conductivity in w/mK
h =Inside heat transfer coefficient in w/m2K [4 w/m2K is commonly assumed]
Ainp = Insulated surface area of tank in m2ATTS = Total tank surface area (shell + roof) in m2
Concluding remarks
The following method is the latest method used in API Std 2000, ISO 28300 & EN 14015. Nevertheless, API Std 2000 (6th edition) still maintaining the old method in ANNEX A as an alternative approach in determining normal venting rate. Comparison and recommendation can be found in "Tank Venting - API Std 2000 (Nov 2009) - Revised method and Old Method in ANNEX A".
In determining normal tank venting rate per ANNEX A, designer can estimate tank venting rate from a table. Siddhartha has presented an equation to predict tank venting based on simple correlation, as discussed in " Tank Normal Venting Rate Estimation Using Siddhartha Equation". JoeWong has further proposed a new correlation as discussed in "Tank Thermal Breathing - Proposed Equation Correlate API Std 2000 Data" with better accuracy.
Ref :
i) API Std 2000 "Venting Atmospheric and Low-Pressure Storage Tanks", 6th Edition, Nov. 2009
ii) ISO 28300 "Petroleum. petrochemical and natural gas industries - Venting Atmospheric and Low-Pressure Storage Tanks"
iii) EN 14015 "Specification for the design and manufacture of site built, vertical, cylindrical, flat-bottomed, above ground, welded, steel tanks for the storage of liquids at ambient temperature and above "
**********************************
Above equations have been programmed by Ankur, an experience Chemical Engineer, share with readers of Chemical and Process Technology. You may download here.
Thanks to Ankur
Download
*If you have any useful program and would like to share within our community, please send to me.
Related Post
- Tank Venting - API Std 2000 (Nov 2009) - Revised method and Old Method in ANNEX A
- Tank Thermal Breathing - Proposed Equation Correlate API Std 2000 (Annex A)
- Tank Normal Venting Rate Estimation Using Siddhartha Equation
- Find Latitude & Longitude Using GOOGLE MAP
- PSV for Shell-and-Tube HEX Tube Side Overpressure Protection against External Fire Attack ?
- Should we consider JET FIRE for Pressure Relief Valve (PSV) load determination ?
- Protective Measures against FIRE other than Pressure Relief Device (PRD)
- Extra Caution When Eliminating Overpressure by Fire Attacks
Labels: Environment, Overpressure Protection, Tank
Monday, March 8, 2010
Liquid product like Chemical, condensate, etc is commonly stored in fixed roof vertical cylindrical tank. Inert gas blanketing system is provided to avoid air and moisture contact and contaminate liquid product. Liquid movement by content filling (pump-in) or emptying (pump out) and weather changes (ambient heating or cooling) will results internal pressure increase (overpressure) or decrease (vacuum) in the tank. Thus, an overpressure and vacuum protecting system providing inbreathing or outbreathing gas is provided to maintain a constant pressure in the tank.
There are several recommended practice (RP) and standard (STD) are available to guide engineers in designing and specifying venting / relief load from a storage tank.
- API Std 2000 "Venting Atmospheric and Low-Pressure Storage Tanks"
- ISO 28300 "Petroleum. petrochemical and natural gas industries - Venting Atmospheric and Low-Pressure Storage Tanks"
- EN 14015 "Specification for the design and manufacture of site built, vertical, cylindrical, flat-bottomed, above ground, welded, steel tanks for the storage of liquids at ambient temperature and above "
Recommended :Tips on Succession in FREE Subscription
Subscribes to FREE Hydrocarbon Processing
 In determining normal tank venting rate, API STD 2000, (edition 1999) allows designer to estimate tank venting rate from a table. Siddhartha has presented an equation to predict tank venting based on simple correlation, as discussed in " Tank Normal Venting Rate Estimation Using Siddhartha Equation". JoeWong has further proposed a new correlation as discussed in "Tank Thermal Breathing - Proposed Equation Correlate API Std 2000 Data" with better accuracy.
The methodology in determining normal inbreathing and outbreathing rate are different between API Std 2000 and ISO 28300 / EN14015. Groth Corporation, a well known Pressure-Vaccum relief valve manufacture has conducted a study to compare the API Std 2000 and ISO 28300 / EN14015. A few differences are identified :
Subscribes to FREE Hydrocarbon Processing
In determining normal tank venting rate, API STD 2000, (edition 1999) allows designer to estimate tank venting rate from a table. Siddhartha has presented an equation to predict tank venting based on simple correlation, as discussed in " Tank Normal Venting Rate Estimation Using Siddhartha Equation". JoeWong has further proposed a new correlation as discussed in "Tank Thermal Breathing - Proposed Equation Correlate API Std 2000 Data" with better accuracy. The methodology in determining normal inbreathing and outbreathing rate are different between API Std 2000 and ISO 28300 / EN14015. Groth Corporation, a well known Pressure-Vaccum relief valve manufacture has conducted a study to compare the API Std 2000 and ISO 28300 / EN14015. A few differences are identified :
API STD 2000
- Full vacuum through 1.034 barg
- Aboveground tanks for liquid petroleum or petroleum products and aboveground and underground refrigerated storage tanks
- Fixed roof tanks
- Tank volumes up to 28,618m3
- No insulation factor considered for regular venting (emergency only)
EN 14015
- -20 mbar through 500 mbar
- Non-refrigerated tanks
- Fixed roof tanks (with or without internal floating roofs)
- No limit on tank volume
- Insulation considered for regular and emergency venting
ISO 28300
- Full vacuum through 1.034 barg
- Aboveground tanks for liquid petroleum or petroleum products and aboveground and underground refrigerated storage tanks
- Fixed roof tanks
- No limit on tank volume
- Insulation considered for regular and emergency venting
One of the interesting findings in the study was the normal inbreathing and outbreathing comparison betweeen API STD 2000 and ISO 28300/EN 14015.

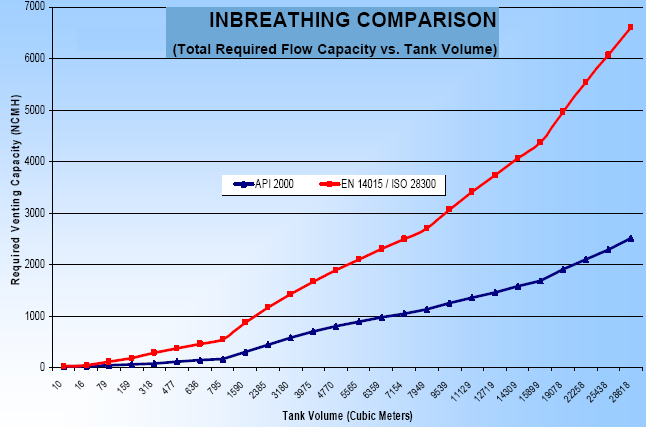
(Click image for large image)
Source : Groth Corporation
Details can be found in " Introduction and ISO 28300 Presentation". Above study was comparing API STD 2000, revision 1999 and latest ISO 28300 / EN 14015. API has recently released latest API STD 200, last NOV 2009. One of the main changes was synchronizing methodology between API STD 2000 rev. Nov 2009 and latest ISO 28300 / EN 14015.
Opinions
Previous method used in API STD 2000 still maintain in Annex A as "Alternative Calculation of normal venting requirements". This annex provides a calculation approach that may be used to design protection systems for the normal venting requirement of petroleum storage tank.
Above finding indicates minor difference in outbreathing rate between API STD 2000 and ISO 28300 / EN 14015. Both methods are acceptable for estimating outbreathing (in main text and annex A). However, present inbreathing method (as in annex A) consistently lower compare to revised method. It is always take extra precaution when you used annex A for estimating inbreathing rate.
You may be working on ongoing project priors to revision of API STD 2000 (NOV 2009). Following standard implementation spirit, you may continue to use old revision. However, it is always advisable to refer to latest API STD 2000 from safety and integrity aspect.
You may work on revamping or debottlenecking of existing plant, extra precaution shall be taken. Whenever you have modification or new requirement to existing tank, you may have to comply to latest API STD 2000 (NOV 2009) even thought your existing tank was designed and fabricated to old revision of API STD 2000.
You may work on revamping or debottlenecking of existing plant, extra precaution shall be taken. Whenever you have modification or new requirement to existing tank, you may have to comply to latest API STD 2000 (NOV 2009) even thought your existing tank was designed and fabricated to old revision of API STD 2000.
Related Post
- Tank Normal Venting Rate Estimation Using Latest Method As in API Std 2000
- Tank Thermal Breathing - Proposed Equation Correlate API Std 2000 Data
- Tank Normal Venting Rate Estimation Using Siddhartha Equation
- PSV for Shell-and-Tube HEX Tube Side Overpressure Protection against External Fire Attack ?
- Should we consider JET FIRE for Pressure Relief Valve (PSV) load determination ?
- Protective Measures against FIRE other than Pressure Relief Device (PRD)
- Extra Caution When Eliminating Overpressure by Fire Attacks
Labels: Environment, Overpressure Protection, Tank
Saturday, August 22, 2009
Display problem ? Click HERE
Recommended :

Flare is commonly installed in oil and gas process plant to burn hydrocarbon and/or toxic gas to avoid formation of combustible mixture, to minimize green house effect (GHE), to minimize health hazards to personnel on site, etc. There are several earlier posts related to Flare :
- Quick Estimate Flare Stack Diameter
- Estimate Subsonic Flare Tip Pressure Drop With Graph Derived Correlation
- Quick Estimate Flare Tip Pressure Drop
- Flare Tip Type Quick Selection Chart
- Guideline on Quick Determination of Flare Stack Support Type
- Flare Smokeless Ringlemann Chart
- FLARE combustion efficiency
- Quick Estimate Ground Level Unburnt Flammable Gas For Vent Pipe or Flame-out Flare Stack
Flare collection header is normally "NO flow" as most (if not all) devices connected to flare header are non-discharging fluid into flare system. Among all are pressure relief valve (PRV), blowdown valve (BDV), overpressure dump valve (PCV), etc. All these devices are kept as close position during normal plant operation and will only open in the event of overpressure, emergency situation i.e. fire, runaway reaction, plant shutdown/blowdown for maintenance.
On the flare tip end, it is open to atmosphere. it is very likely that atmosphere air contain oxygen ingress and stay into flare collection header. PRV/BDV/PCV passing and open on demand will discharge large quantity of hydrocarbon gas into flare collector header filled with air and create combustible mixture, as this combustible mixture travel along flare header and reach flare tip which equipped with flare pilot, combustible mixture will be ignited and potentially created flash back to the flare header and flare knock-out drum (KOD). Subject to flare header capacity and mechanical integrity, large flash back lead to severe internal pressure act on the piping & vessel and vapor wave results severe vibration and movement of structure, this potential lead to catastrophe failure of flare collection system. Therefore a flare header is sweep or purge with fuel gas or inert gas i.e. Nitrogen.
Advantages using inert gas compare to fuel gas as purge gas
i) Environment & Green House Effect (GHE)
IG : Inert gas has NO impact to environment
FG : Burn fuel gas in atmosphere generate Carbon Dioxide (CO2) which contributes to increase of Co2 content in atmosphere and increases Green House Effect (GHE)
ii) Burn back damage flare tip - reduce life span of flare tip
IG : Inert gas do not burn. NO burn back and potential damage of flare tip.
FG : Potential FG burn back damage flare and shorten flare tip life span.
iii) High OPEX avoid Burn back
IG : NO burn back. Minimum purge rate and low OPEX.
FG : Potential burn back lead to high purge rate (potential 10 times higher than purge rate of IG) and high OPEX
iv) Visible Flame
IG : Inert gas do not burn. No flame present.
FG : FG continuous burn and continuous visible flare at flare tip. Potential create uneasy situation in environment sensitive area.
v) Smoke Flaring
IG : Inert gas do not burn. No smoke flaring issue.
FG : Burning heavy FG lead to smoke flaring. Potential create uneasy situation in environment sensitive area. Increase likelihood of unburnt component and impact on environment.
vi) Steam injection for smokeless flaring
IG : Inert gas do not burn. No smoke flaring issue.
FG : Burning heavy FG lead to smoke flaring. Steam injection to reduce/eliminate smoke flaring. This increases CAPEX (additional steam injection facilities) and OPEX (steam loss).
vii) Radiation
IG : Inert gas do not burn. No additional radiation.
FG : Fuel gas burn lead to increase of radiation level (on top of solar radiation) to personnel working near flare stack.
Disadvantages using inert gas compare to fuel gas as purge gas
a) Fuel Gas Readily Available in Plant
IG : Required Nitrogen generator or use of Liquid Nitrogen and evaporator. Additional CAPEX and OPEX.
FG : Fuel gas readily available in plant. Minimum CAPEX and OPEX. Some plant generate hydrocarbon gas which shall be disposed off. This gas is readily serve as purge gas and inccur NO cost.
b) Inert Gas Cloud
IG : Flare system purge with inert gas, entire flare system is filled with IG gas (which potential heavier than air). Once any PSV/BDV open and release large amount of gas into flare header, it will "push" IG release through the flare tip. Heavy IG (compare to air) will sink create a IG gas cloud near plant. This is potential fatal thread (suffocation) to personnel on site.
FG : Continuous flaring lead to no or nearly no potential of gas present in atmosphere
c) Unburnt hydrocarbon gas emission
IG : PRV/BDV/PCV leak or passing lead to low heating value mixure (less than 200 btu/ft3) which is non-combustible. Release of hydrocarbon gas into atmosphere directly has more GHE impact than burning it. For example 1 mol of methane create 1 mol of CO2 if it is burnt. 1 mol of methane create 20-21 mol of equivalent CO2 if it unburnt.
FG : Continuous flaring lead to no or nearly no unburnt gas in atmosphere
d) Combustible Cloud lead to Instant Ignition
IG : Slowly hydrocarbon gas emission to atmosphere and built-up of combustible mixture in the plant, once the heating value for auto-ignition is reached, the combustible mixture potentially ignited. Its impact is just like a explosion and potential thread to personnel and surrounding facilities.
FG : Continuous flaring lead to no or nearly no unburnt gas in atmosphere
Concluding remark
Inert gas purging is normally understood as clean, low CAPEX, low OPEX, etc and regards as most likely candidate for flare purging. However, the associated SAFETY related issue may needs additional attention and focus. All...use inert gas wisely...
Related Topic
- Flare related topics...
- CO2 related topics...
- Personnel Exposure Time For Heat Radiation
- Heat Radiation For Pain & Blistering Threshold
- Simplified Equation for Wind Speed Estimation At Different Height
- Estimate Wind Speed At Flare Tip At Different Height
- Assess AIV with "D/t-method" with Polynomial PWL Limit Line
- Model Fix Pressure Drop Device in FLARENET
Labels: CO2, Environment, Fire, Flare
Sunday, August 9, 2009
Recommended :
- Subscribe FREE - Chemical Engineering
- Tips on Succession in FREE Subscription
 Earlier post "Heat Radiation For Pain & Blistering Threshold" and "Personnel Exposure Time For Heat Radiation" have discussed the heat radiation level lead to plant personnel pain and blistering threshold within an exposure time. Heat radiation design criteria for personnel exposure has been proposed for continuous and emergency exposure. Flare radiation run using software i.e. FLARESIM or calculation using Brzustowski and Sommer method, heat radiation level will be estimated and presented. For equipment, instrument, piping, painting, steel structure, etc expose to flare radiation will experienced increase temperature.
How shall a heat radiation level relates to temperature ?
- Subscribe FREE - Chemical Engineering
- Tips on Succession in FREE Subscription
Earlier post "Heat Radiation For Pain & Blistering Threshold" and "Personnel Exposure Time For Heat Radiation" have discussed the heat radiation level lead to plant personnel pain and blistering threshold within an exposure time. Heat radiation design criteria for personnel exposure has been proposed for continuous and emergency exposure. Flare radiation run using software i.e. FLARESIM or calculation using Brzustowski and Sommer method, heat radiation level will be estimated and presented. For equipment, instrument, piping, painting, steel structure, etc expose to flare radiation will experienced increase temperature.How shall a heat radiation level relates to temperature ?
Heat level (Et) at recepting location can be related to the sum of radiation heat (Er) plus convection heat (Ec).
Et = Er + Ec
For unit area (m2),
qt = qr + qc
where
qt = total heat flux at receptor (kW/m2)
qr = radiation heat flux at receptor (kW/m2)
qc = convection heat flux at receptor (kW/m2)
Radiation heat flux,
qr = sigma x (T4 - Ta4)
Convection heat flux
qc = (h / e) x (T - Ta)
where
sigma = stefan-Boltzman constant = 5.67 e -11 (kW/m2K)
h = convective heat transfer co-efficient = 0.007 (kW/m2K) at zero wind speed
e = Emissivity (0.8-0.9 for copper or rusted CS pipe, 0.1-0.2 for polished SS pipe)
T = Surface temperature (K)
Ta = Ambient temperature (K)
Therefore
qt = sigma x (T4 - Ta4) + (h / e) x (T - Ta)
If a heat radiation level is known at particular location, the corresponding temperature may be estimated using above equation.
Related Topic
- Personnel Exposure Time For Heat Radiation
- Heat Radiation For Pain & Blistering Threshold
- Simplified Equation for Wind Speed Estimation At Different Height
- Estimate Wind Speed At Flare Tip At Different Height
- Assess AIV with "D/t-method" with Polynomial PWL Limit Line
- Model Fix Pressure Device in FLARENET
- Several Criteria and Constraints for Flare Network - Process
- Several Criteria and Constraints for Flare Network - Piping
Labels: Environment, Flare
Monday, August 3, 2009
Display problem ? Click HERE
Recommended :
Subscribe FREE - Chemical Processing

Earlier post "Heat Radiation For Pain & Blistering Threshold" has briefing discussed about the exposure time for heat radiation level which lead pain and blister threshold. Equations have been proposed in order to link between exposure time for dedicated heat radiation. Example, with heat radiation of 6.3 kW/m2 (2 000 Btu/h·ft2), the pain threshold is reached in 8 s and blistering occurs in 20 s.
Maximum allowable personnel exposure time to particular heat radiation level proposed in API RP 521 (previous revision - 1997) and API Std 521 (latest revision - May 2008) are marginally different. Detail list out as follow
Above listing shows that latest API Std 521 has more stringent requirement compare to previous revision (1997), specifically for 6.31 and 4.73 kW/m2. The maximum allowable exposure time limit have been reduced. Continuous exposure limit remain unchanged.
Emergency Exposure
Maximum allowable exposure heat radiation of 6.31 and 4.73 kW/m2 (during emergency scenario) have been used as criteria in determining sterile area, an area around flare stack which no personnel shall be around without any personnel protective apparel. For conservative design and/or expect potential increase in flaring rate in future, a limit of 4.73 kW/m2 may be used. For common design, heat radiation limit of 6.31 kW/m2 is widely used. In general, maximum allowable heat radiation of 9.46 kW/m2 will be limited at the flare stack base where personnel may access to sterile area with proper personnel protective apparel.
Continuous Exposure
For continuous exposure, operator is assumed wearing appropriate clothing in a plant. Heat radiation at any location shall be limited to 1.58 kW/m2.
Related Topic
Subscribe FREE - Chemical Processing
Earlier post "Heat Radiation For Pain & Blistering Threshold" has briefing discussed about the exposure time for heat radiation level which lead pain and blister threshold. Equations have been proposed in order to link between exposure time for dedicated heat radiation. Example, with heat radiation of 6.3 kW/m2 (2 000 Btu/h·ft2), the pain threshold is reached in 8 s and blistering occurs in 20 s.
Maximum allowable personnel exposure time to particular heat radiation level proposed in API RP 521 (previous revision - 1997) and API Std 521 (latest revision - May 2008) are marginally different. Detail list out as follow
| Heat Radiation (kw/m2) | API Rp 521 (March 1997) | API Std 521 (May 2008) |
| 9.45 | Exposure must be limited to a few (approx. six) seconds, sufficient for escape only. May consider tower or structure provide some degree of shielding. | Required urgent emergency action. Radiation shielding and/or special protective apparel (e.g. a fire approach suit) required |
| 6.31 | Emergency actions lasting up to 1 minutes without shielding but with appropriate clothing. | Emergency actions lasting up to 30s without shielding but with appropriate clothing. |
| 4.73 | Emergency actions lasting up to several minutes without shielding but with appropriate clothing. | Emergency actions lasting 2 min to 3 min without shielding but with appropriate clothing. |
| 1.58 | personnel with appropriate clothing can be continuously exposed | personnel with appropriate clothing can be continuously exposed |
Above listing shows that latest API Std 521 has more stringent requirement compare to previous revision (1997), specifically for 6.31 and 4.73 kW/m2. The maximum allowable exposure time limit have been reduced. Continuous exposure limit remain unchanged.
Emergency Exposure
Maximum allowable exposure heat radiation of 6.31 and 4.73 kW/m2 (during emergency scenario) have been used as criteria in determining sterile area, an area around flare stack which no personnel shall be around without any personnel protective apparel. For conservative design and/or expect potential increase in flaring rate in future, a limit of 4.73 kW/m2 may be used. For common design, heat radiation limit of 6.31 kW/m2 is widely used. In general, maximum allowable heat radiation of 9.46 kW/m2 will be limited at the flare stack base where personnel may access to sterile area with proper personnel protective apparel.
Continuous Exposure
For continuous exposure, operator is assumed wearing appropriate clothing in a plant. Heat radiation at any location shall be limited to 1.58 kW/m2.
Related Topic
- Heat Radiation For Pain & Blistering Threshold
- Simplified Equation for Wind Speed Estimation At Different Height
- Estimate Wind Speed At Flare Tip At Different Height
- Assess AIV with "D/t-method" with Polynomial PWL Limit Line
- Model Fix Pressure Device in FLARENET
- Several Criteria and Constraints for Flare Network - Process
- Several Criteria and Constraints for Flare Network - Piping
- Provide More than One Flare KOD in SERIES
Labels: Environment, Flare
Sunday, July 26, 2009
Display problem ? Click HERE
Recommended :Flare is commonly installed in oil and gas process plant to burn hydrocarbon and/or toxic gas to avoid formation of combustible mixture, to minimize green house effect (GHE), to minimize health hazards to personnel on site, etc. Flaring hydrocarbon gas may generate carbon dioxide & water for complete combustion and soot (contribute to smokeless level) & unburnt components (contributes to toxic environment) for incomplete combustion. Besides, heat and noise are generated and radiated and transmitted around the flare tip.
Heat radiated from flare may transmitted in sphere form around the flare tip. Along the transmission, the energy is distributed in sphere form and this lead to reduction in heat radiation level (heat flux, kW/m2). Personnel or equipment along the transmission path will expose to this heat radiation. Personnel or equipment closer to flare tip will experience higher heat radiation level.
With studies conducted by Stoll and Greene (1958), following graph relate heat radiation versus time for Pain threshold and Blister threshold. With heat radiation of 6.3 kW/m2 (2 000 Btu/h·ft2), the pain threshold is reached in 8 s and blistering occurs in 20 s.

The following equation derived from above graph and can be used to relates heat radiation with time for pain and blister thresholds.
Pain threshold :
Blister threshold :
where :
q = heat radiation (kW/m2)
t = time (seconds)
Ref :
(i) A. M. STOLL and L. C. GREEN, The Production of Burns by Thermal Radiation of Medium Intensity, Paper Number 58-A-219, American Society of Mechanical Engineers, New York, 1958
Related Topic
Heat radiated from flare may transmitted in sphere form around the flare tip. Along the transmission, the energy is distributed in sphere form and this lead to reduction in heat radiation level (heat flux, kW/m2). Personnel or equipment along the transmission path will expose to this heat radiation. Personnel or equipment closer to flare tip will experience higher heat radiation level.
With studies conducted by Stoll and Greene (1958), following graph relate heat radiation versus time for Pain threshold and Blister threshold. With heat radiation of 6.3 kW/m2 (2 000 Btu/h·ft2), the pain threshold is reached in 8 s and blistering occurs in 20 s.
The following equation derived from above graph and can be used to relates heat radiation with time for pain and blister thresholds.
Pain threshold :
q = 25.544 x t -0.6742
Blister threshold :
q = 75.691 x t -0.8399
where :
q = heat radiation (kW/m2)
t = time (seconds)
Ref :
(i) A. M. STOLL and L. C. GREEN, The Production of Burns by Thermal Radiation of Medium Intensity, Paper Number 58-A-219, American Society of Mechanical Engineers, New York, 1958
Related Topic
- Simplified Equation for Wind Speed Estimation At Different Height
- Estimate Wind Speed At Flare Tip At Different Height
- Assess AIV with "D/t-method" with Polynomial PWL Limit Line
- Model Fix Pressure Device in FLARENET
- Several Criteria and Constraints for Flare Network - Process
- Several Criteria and Constraints for Flare Network - Piping
- Provide More than One Flare KOD in SERIES
Labels: Environment, Flare, Noise
Monday, June 15, 2009
Display problem ? Click HERE
Recommended :
Subscribe FREE - Chemical Processing
As discussed in earlier post "Estimate Wind Speed At Flare Tip At Different Height", correct wind speed at flare tip (elevated flare) is important in order to obtain correct estimate of radiation level and unburnt component concentration at downwind location, determination of minimum vapor flow to avoid flame-out and performance of pilots. A rather complicated equations may be used to estimate wind speed at different height.
This will present a rather simple relation to estimate the wind speed. The following equation may be considered.

Where
UZ = Wind speed at Z m at return duration of t0 hour (m/s)
U0 = Wind speed at specified height of 10m at return duration of t0 hour (m/s)
t0 = Wind speed at return duration i.e. 60 minutes, 1 minutes, etc
Z = Flare stack height (m)
K = Field data derived parameter (may use 0.125)
Example :
A flare stack with height of 200m, expose to wind speed (at 60 minutes return duration) of 10 m/s measured at 10m from grade. Determine wind speed at flare tip if the return duration stay as 60 minutes.
Solution (a)
Z = 200 m
U0 = 10 m/s
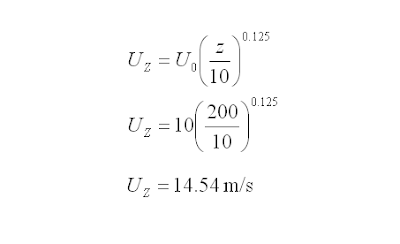
UZ = 14.54 m/s
Wind speed at flare tip with return duration stay as 60 minutes = 14.54 m/s
Related Topic
Subscribe FREE - Chemical Processing
As discussed in earlier post "Estimate Wind Speed At Flare Tip At Different Height", correct wind speed at flare tip (elevated flare) is important in order to obtain correct estimate of radiation level and unburnt component concentration at downwind location, determination of minimum vapor flow to avoid flame-out and performance of pilots. A rather complicated equations may be used to estimate wind speed at different height.This will present a rather simple relation to estimate the wind speed. The following equation may be considered.

UZ = Wind speed at Z m at return duration of t0 hour (m/s)
U0 = Wind speed at specified height of 10m at return duration of t0 hour (m/s)
t0 = Wind speed at return duration i.e. 60 minutes, 1 minutes, etc
Z = Flare stack height (m)
K = Field data derived parameter (may use 0.125)
Example :
A flare stack with height of 200m, expose to wind speed (at 60 minutes return duration) of 10 m/s measured at 10m from grade. Determine wind speed at flare tip if the return duration stay as 60 minutes.
Solution (a)
Z = 200 m
U0 = 10 m/s

UZ = 14.54 m/s
Wind speed at flare tip with return duration stay as 60 minutes = 14.54 m/s
Related Topic
- Estimate Wind Speed At Flare Tip At Different Height
- Assess AIV with "D/t-method" with Polynomial PWL Limit Line
- Model Fix Pressure Device in FLARENET
- Several Criteria and Constraints for Flare Network - Process
- Several Criteria and Constraints for Flare Network - Piping
- Provide More than One Flare KOD in SERIES
Labels: Environment, Flare
Thursday, June 11, 2009
Display problem ? Click HERE
Recommended :
Flare is commonly installed in oil and gas process plant to burn hydrocarbon and/or toxic gas to avoid formation of combustible mixture, to minimize green house effect (GHE), to minimize health hazards to personnel on site, etc. There are several earlier posts related to Flare :
- Quick Estimate Flare Stack Diameter
- Estimate Subsonic Flare Tip Pressure Drop With Graph Derived Correlation
- Quick Estimate Flare Tip Pressure Drop
- Flare Tip Type Quick Selection Chart
- ANSI/API Std 537 / ISO 25457 2nd edition, Dec 2008 is Released
- Guideline on Quick Determination of Flare Stack Support Type
- Flare Smokeless Ringlemann Chart
- Must Read Flare Handbook
- FLARE combustion efficiency
- Quick Estimate Ground Level Unburnt Flammable Gas For Vent Pipe or Flame-out Flare Stack
- Elevated Flare (SI Unit) Datasheet
- Enclosed Flare (SI Unit) Datasheet
Wind speed affects flare performance at least in few ways :
- Wind drag flame to downwind, lower the flame center and radiation level of downwind receptor
- Wind carry unburnt component to downwind
- Wind potential put-off flame on flare under low gas flow and pilot
Wind speed change with flare height
One of characteristic of wind speed is wind speed increase with height from grade. Thus, higher the flare stack, flare tip will expose to higher wind speed. Generally wind map will be obtained from local authority or organization. The wind map may be measured at specific height i.e. 10m from grade.
In case flare stack height is different than wind speed at specific height, how shall an engineer determine wind speed flare tip ?
Corrected wind speed (without return duration correction)

Where
UZ = Wind speed at Z m at return duration of t0 hour (ft/s)
U0 = Wind speed at specified height of 10m at return duration of t0 hour (ft/s)
t0 = Wind speed at return duration i.e. 60 minutes, 1 minutes, etc
Z = Flare stack height (ft)
Corrected wind speed (with return duration correction)

Where
t = Wind speed at return duration i.e. 60 minutes, 1 minutes, etc (different than t0 )
Example :
A flare stack with height of 200m, expose to wind speed (at 60 minutes return duration) of 10 m/s measured at 10m from grade. Determine wind speed at flare tip if (a) the return duration stay as 60 minutes (b) return duration change to 1 minute.
Solution (a)
Z = 200 m = 200 x 32.8 ft
UZ = 10 m/s = 10 x 32.8 ft/s

UZ = 41.7 ft/s = 12.7 m/s
Wind speed at flare tip with return duration stay as 60 minutes = 12.7 m/s
Solution (b)

uZ,t = 44.8 ft/s = 13.66 m/s
Wind speed at flare tip with return duration at 1 minutes = 13.66 m/s
Related Topic
- Assess AIV with "D/t-method" with Polynomial PWL Limit Line
- Model Fix Pressure Device in FLARENET
- Several Criteria and Constraints for Flare Network - Process
- Several Criteria and Constraints for Flare Network - Piping
- Provide More than One Flare KOD in SERIES
Labels: Environment, Flare
Sunday, May 17, 2009
Display problem ? Click HERE
Recommended :
Tips on Succession in FREE Subscription
Subscribes to FREE Hydrocarbon Processing
Earlier post "Tank Normal Venting Rate Estimation Using Siddhartha Equation", Siddhartha equation has been presented. The proposed equations are rather simple and easy to use.
Following post will discuss the comparison between prediction Siddhartha equation and API Std 2000 data. New equations with better accuracy are proposed.
Thermal Inbreathing
From earlier post, thermal inbreathing flow cause by ambient cooling can be determined based on following equations :
If Vtank less than or equal to 3500 m3,
where
Qthermal in,air = Thermal inbreathing in Sm3/h (Air)
Vtank = Tank capacity in m3
To convert Sm3/h to Nm3/h, divide inbreathing / outbreathing flow with a factor of 1.055. Refer "Relate NORMAL to STANDARD Volumetric Flow"
The error difference for thermal inbreathing between above equations and API Std 2000 data is about :
If Vtank more than 3500 m3, a polynomial equation is proposed.
with
a = -4.333E-23
b = + 4.974E-18
c = - 2.281E-13
d = + 5.328E-09
e = - 6.681E-05
f = + 0.494
g = - 549.435
where
Qthermal in,air = Thermal inbreathing in Nm3/h (Air)
Vtank = Tank capacity in m3
Thermal Outbreathing
From earlier post, thermal outbreathing flow cause by ambient heating can be determined based on following equations :
Liquids with a flash point (FP) greater than 37.8°C or Normal Boiling Point (NBP) above 149°C
If Vtank less than or equal to 3500 m3,
If Vtank more than 3500 m3,
where
Qthermal out,air = Thermal inbreathing in Sm3/h (Air)
Vtank = Tank capacity in m3
The error difference for thermal inbreathing between above equations and API Std 2000 data is in the range of 0.09% - 16.88%
Above error diefference is rather big. However, it may be still acceptable in practical application. Care shall be taken when these equqation are used.
Further investigations found the following equations giving better estimation :
a) Liquids with a flash point (FP) greater than 37.8°C or Normal Boiling Point (NBP) above 149°C
If Vtank less than or equal to 3000 m3,
with
a = -2.659E-12
b = + 6.206E-08
c = - 5.35E-03
d = + 2.073
e = - 2541.692
If Vtank more than 8000 m3,
b) Liquids with a flash point less than 37.8°C or Normal Boiling Point (NBP) below 149°C
Similar equation [3] may be used.
Related Post
Tips on Succession in FREE Subscription
Subscribes to FREE Hydrocarbon Processing
Earlier post "Tank Normal Venting Rate Estimation Using Siddhartha Equation", Siddhartha equation has been presented. The proposed equations are rather simple and easy to use.
Following post will discuss the comparison between prediction Siddhartha equation and API Std 2000 data. New equations with better accuracy are proposed.
Thermal Inbreathing
From earlier post, thermal inbreathing flow cause by ambient cooling can be determined based on following equations :
If Vtank less than or equal to 3500 m3,
Qthermal in,air = 0.178 x Vtank......[1]
If Vtank more than 3500 m3,Qthermal in,air = 3.2 x Vtank0.651......[2]
where
Qthermal in,air = Thermal inbreathing in Sm3/h (Air)
Vtank = Tank capacity in m3
To convert Sm3/h to Nm3/h, divide inbreathing / outbreathing flow with a factor of 1.055. Refer "Relate NORMAL to STANDARD Volumetric Flow"
The error difference for thermal inbreathing between above equations and API Std 2000 data is about :
- 0.17% for tank volume less than or equal to 3500 m3
- 3.75% for tank volume more than 3500 m
If Vtank more than 3500 m3, a polynomial equation is proposed.
Qthermal in,air = a.Vtank6 + b.Vtank5+ c.Vtank4
+ d.Vtank3 + e.Vtank2 + f.Vtank + g ......[3]
+ d.Vtank3 + e.Vtank2 + f.Vtank + g ......[3]
with
a = -4.333E-23
b = + 4.974E-18
c = - 2.281E-13
d = + 5.328E-09
e = - 6.681E-05
f = + 0.494
g = - 549.435
where
Qthermal in,air = Thermal inbreathing in Nm3/h (Air)
Vtank = Tank capacity in m3
The error difference for thermal inbreathing between above proposed equation and API Std 2000 data is about 1.25% for tank volume more than 3500 m
Thermal Outbreathing
From earlier post, thermal outbreathing flow cause by ambient heating can be determined based on following equations :
Liquids with a flash point (FP) greater than 37.8°C or Normal Boiling Point (NBP) above 149°C
If Vtank less than or equal to 3500 m3,
Qthermal out,air = 0.107 x Vtank ......[4]
If Vtank more than 3500 m3,
Qthermal out,air = 1.92 x Vtank0.651 ......[5]
where
Qthermal out,air = Thermal inbreathing in Sm3/h (Air)
Vtank = Tank capacity in m3
The error difference for thermal inbreathing between above equations and API Std 2000 data is in the range of 0.09% - 16.88%
Further investigations found the following equations giving better estimation :
a) Liquids with a flash point (FP) greater than 37.8°C or Normal Boiling Point (NBP) above 149°C
If Vtank less than or equal to 3000 m3,
Qthermal out,air = 0.1012 x Vtank ......[6]
If Vtank more than 3000m3 and less than or equal to 8000 m3,Qthermal out,air =+ a.Vtank4 + b.Vtank3
+ c.Vtank2 + d.Vtank + e ......[7]
+ c.Vtank2 + d.Vtank + e ......[7]
with
a = -2.659E-12
b = + 6.206E-08
c = - 5.35E-03
d = + 2.073
e = - 2541.692
If Vtank more than 8000 m3,
Qthermal out,air = a.Vtank5 + b.Vtank4+ c.Vtank3
+ d.Vtank2 + e.Vtank + f ......[8]
The error difference for thermal inbreathing between above equations and API Std 2000 data is in the range of 0.1 - 3.95%.with
a = 1.0318E-18
b = - 8.775E-14
c = + 2.742E-09
d = - 3.925E-05
e = + 0.302
f = - 282.206
a = 1.0318E-18
b = - 8.775E-14
c = + 2.742E-09
d = - 3.925E-05
e = + 0.302
f = - 282.206
b) Liquids with a flash point less than 37.8°C or Normal Boiling Point (NBP) below 149°C
Similar equation [3] may be used.
Related Post
- Tank Normal Venting Rate Estimation Using Siddhartha Equation
- PSV for Shell-and-Tube HEX Tube Side Overpressure Protection against External Fire Attack ?
- Should we consider JET FIRE for Pressure Relief Valve (PSV) load determination ?
- Protective Measures against FIRE other than Pressure Relief Device (PRD)
- Extra Caution When Eliminating Overpressure by Fire Attacks
- Calculate Wetted Surface Area For Horizontal Vessel With Elliptical Head (Simplified)
- Calculate Wetted Surface Area For Horizontal Vessel With Elliptical Head
Labels: Environment, Tank
